BILL4TIME CASE STUDY
Making Every Billable Hour Count
Overview
I led the redesign of Bill4Time’s Time & Expense tracking system, introducing a monthly calendar view that gave lawyers clear visibility into their billable targets — a critical capability missing from the old weekly grid.
Over 12 weeks, I collaborated with product, engineering, and customer success to research workflows, prototype solutions, and deliver a React-based redesign with bulk editing, clear billing indicators, multi-user filters, and faster performance. These improvements boosted tracking accuracy, helping legal teams stay on target and reclaim hours of administrative time each month.
Goals:
Give lawyers an at-a-glance view of billable progress over an entire month
Reduce time spent on manual edits through bulk editing and faster workflows
Improve billing accuracy with clear billed vs. unbilled indicators
Role
Lead Product Designer
Responsibilities
UX Audit, User Persona, User Research & Data Analysis, Wireframing & Prototyping, Usability Testing (Maze) Design System Components, Competitive Analysis.
Collaborators
Collaborated with a lean cross-functional team, including the VP of Product, Associate Product Designer, a PM, and 8+ Engineers, 2 Customer Success Specialists. I led end-to-end design execution in a fast-paced, high-impact environment.
Impact
+30% feature adoption in first month
–12% churn reduction in first quarter
40% faster load times for high-volume accounts (500+ entries)
Improved NPS from time-tracking users
Reduced weekly admin time by 5+ hours for heavy users
Timeline
3 months
The Challenge
Bill4Time’s weekly-only grid made it hard for law firms to track monthly billable targets, forcing them to run multiple reports and manually calculate totals.
Lawyers and administrative staff were spending 5+ hours each week on manual time tracking, while attorneys handling multiple cases struggled to review and ensure accuracy before invoicing.
USER NEED
Give lawyers and admin staff an at-a-glance monthly view of billable progress, along with faster workflows like bulk editing, multi-user filters, and clear billed vs. unbilled indicators to save time and prevent missed entries.
BUSINESS NEED
Modernize the Time & Expense tracking system to support monthly billing cycles, improve accuracy, and reduce the administrative burden — ultimately increasing adoption and retention.
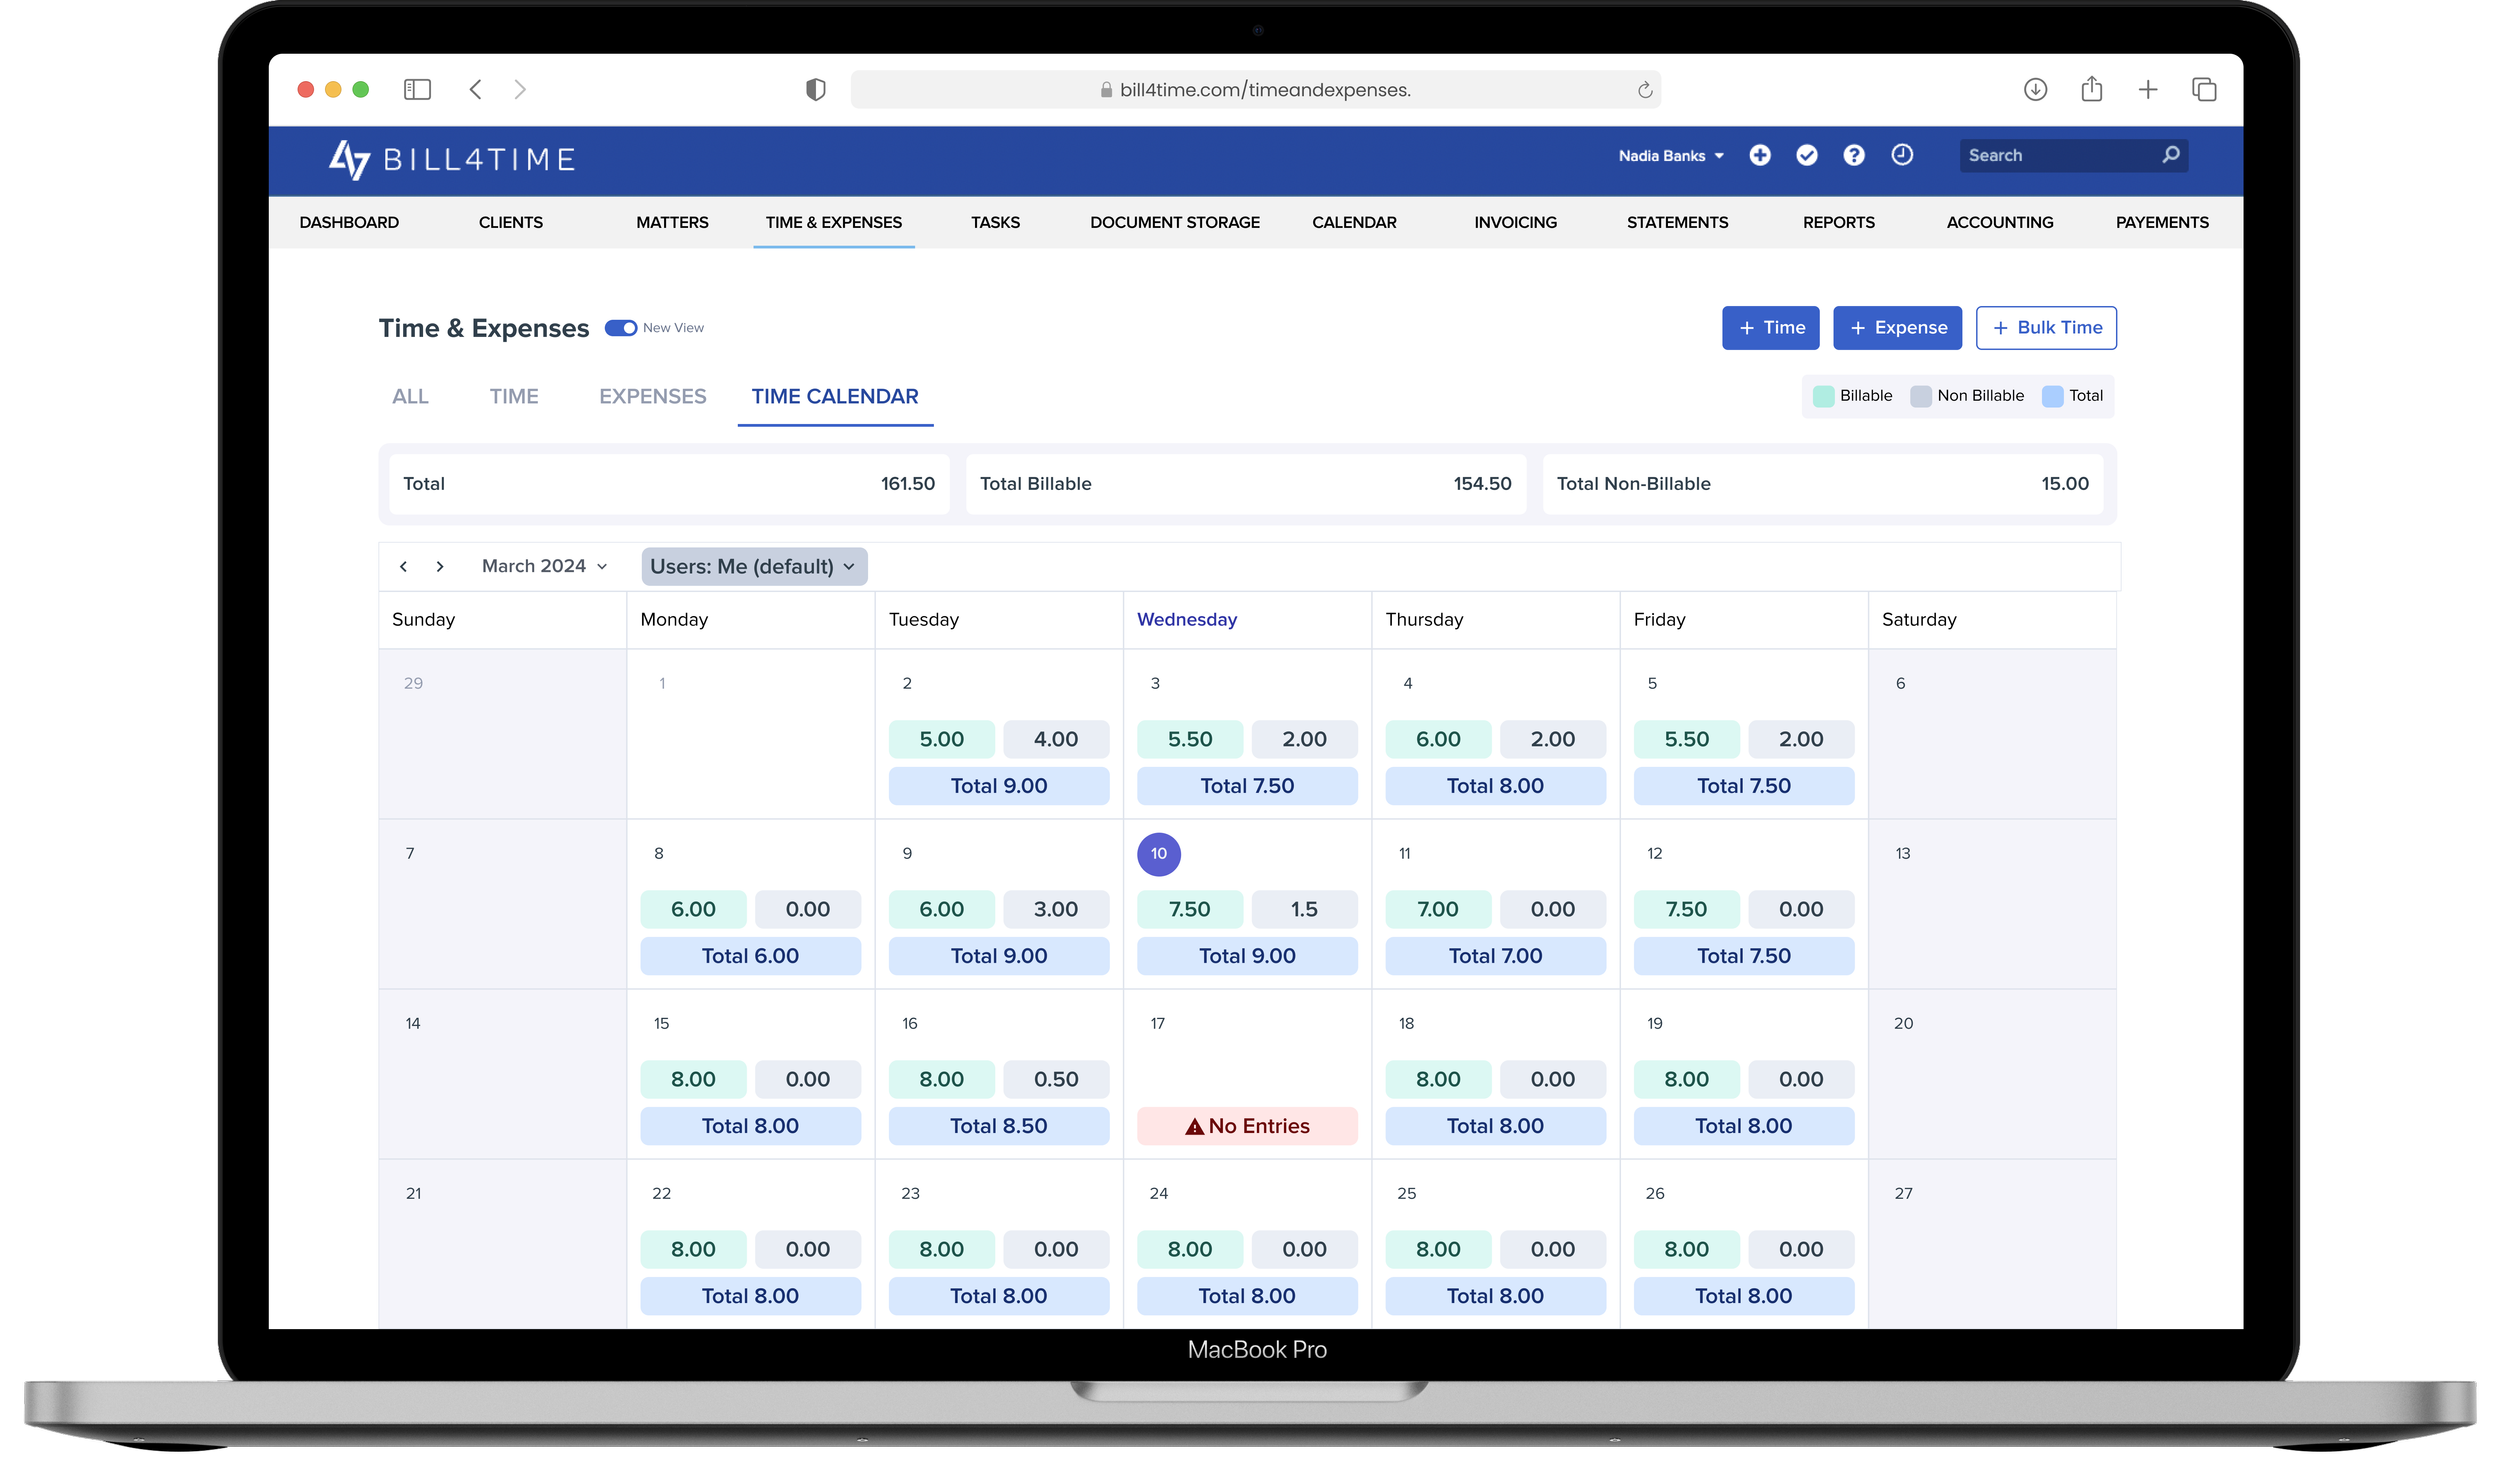
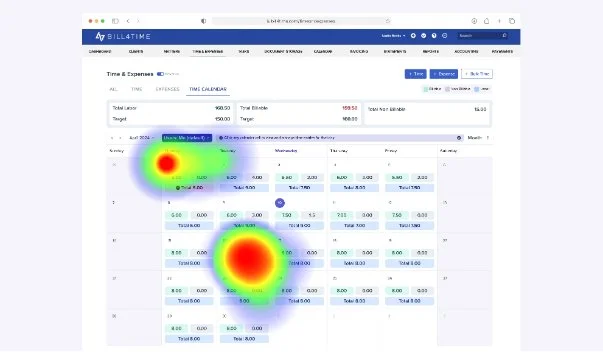
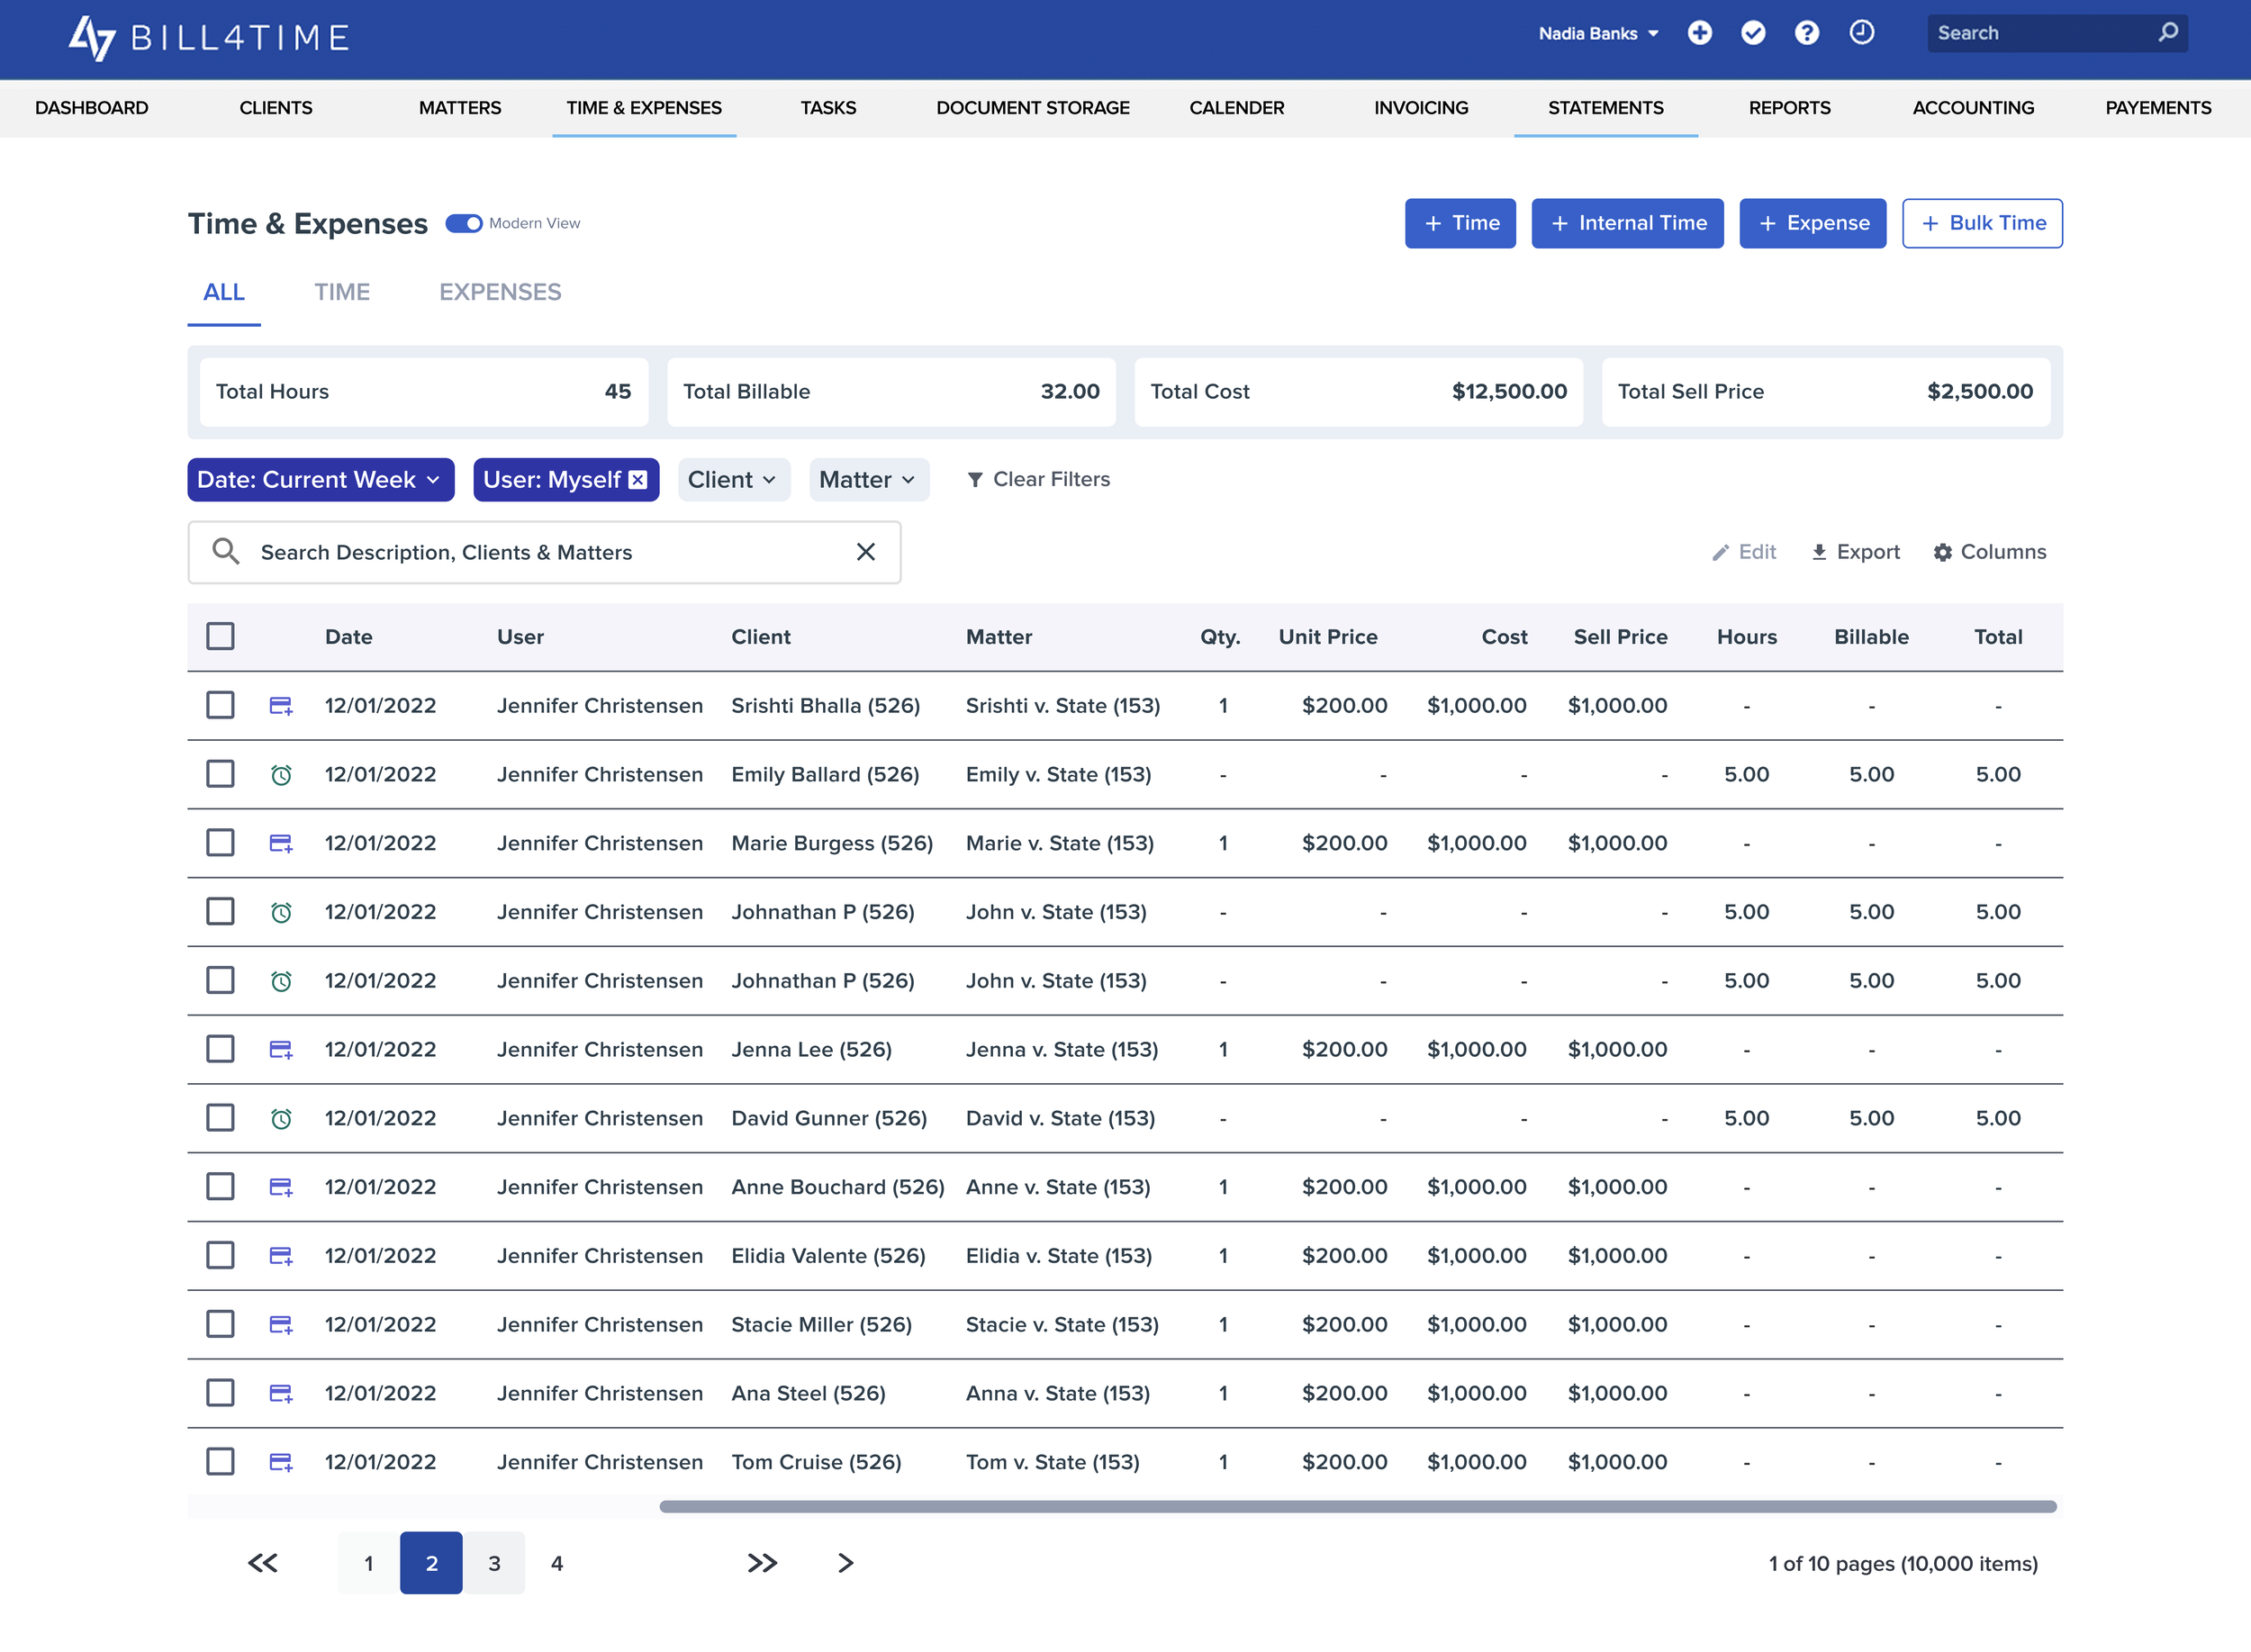
Current time and expensesState of the current system
I analyzed the existing time & expenses section and the current user experience. I conducted a UX auditto spot any usability issues.
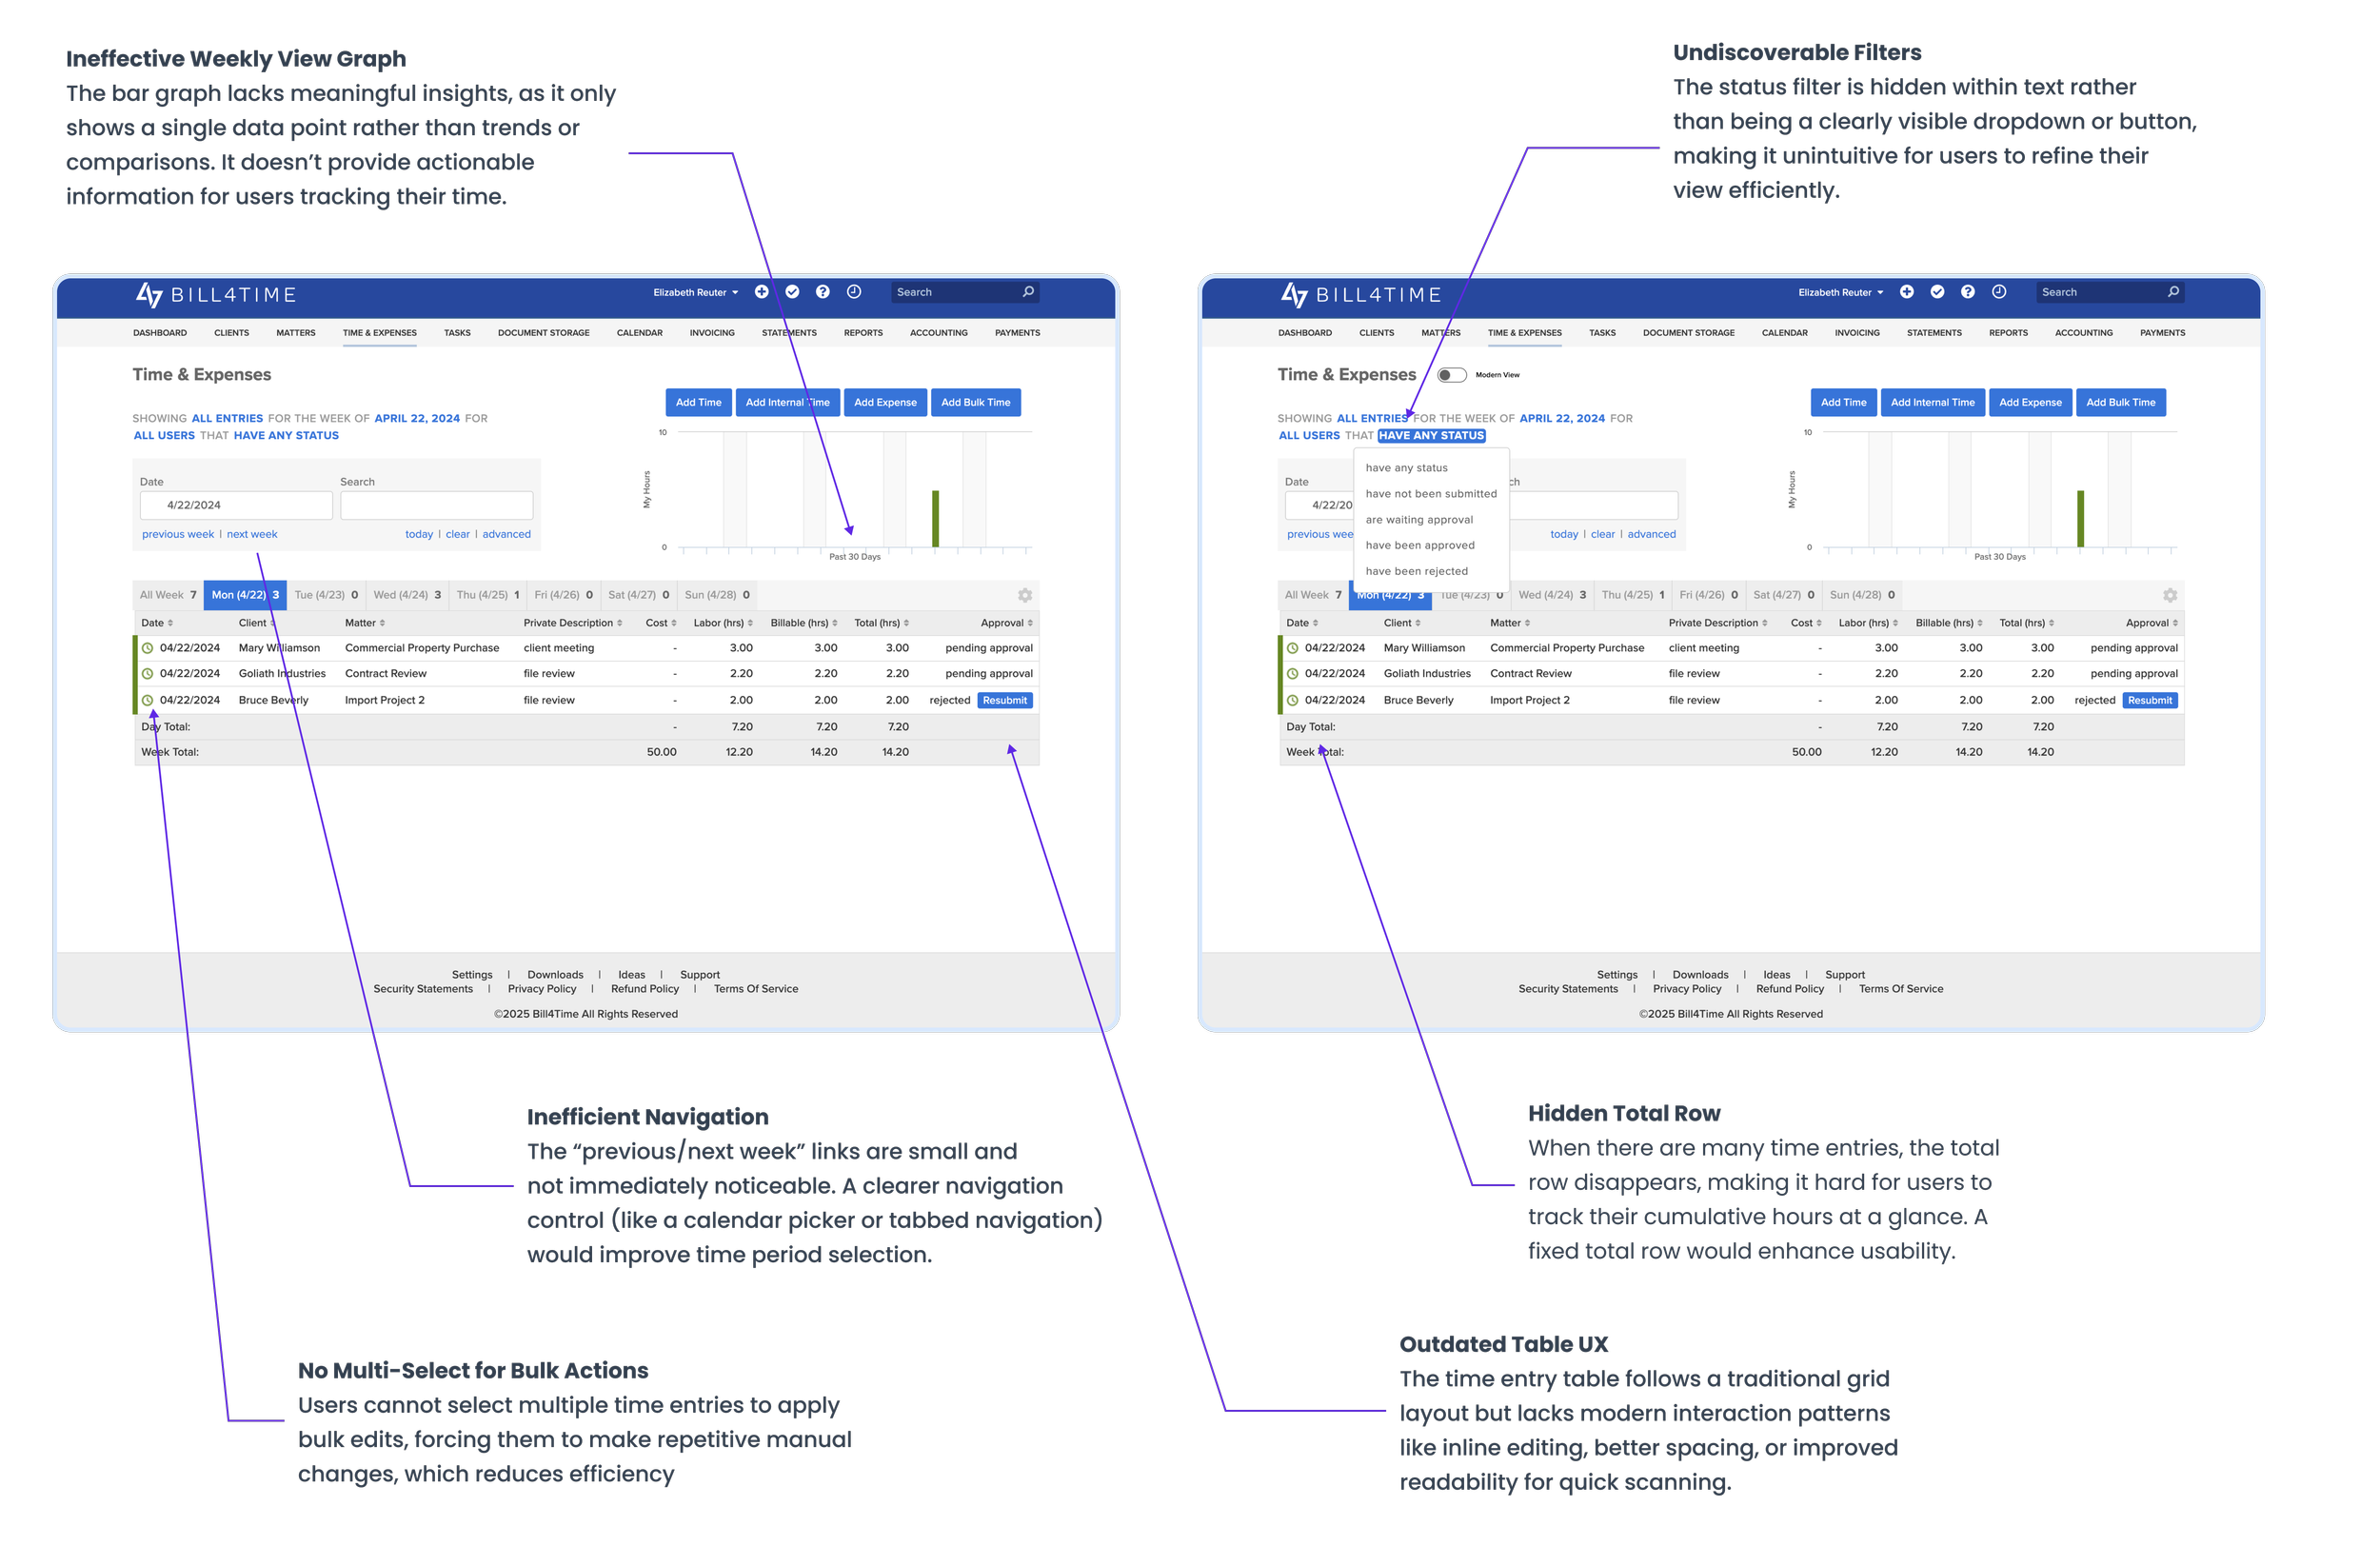
What the data revealed?
+5 hrs
spent by lawyers/admins on manual tracking
Error!
Frequent errors in invoices due to missing entries
+5 average/week
Support tickets related to time tracking inefficiencies were in the top 3 categories
Loading ??
Users with large caseloads reported the weekly view as “unusable” for workload monitoring
Speaking to Lawyers
We began with 2 weeks of user research, speaking to senior paralegals and associate attorneys; the primary users of Bill4Time’s time-tracking features.

“I need to see my monthly hours at a glance so I know if I’m meeting my target; the weekly view is too limiting.”
— Jenna Ali, Associate Attorney
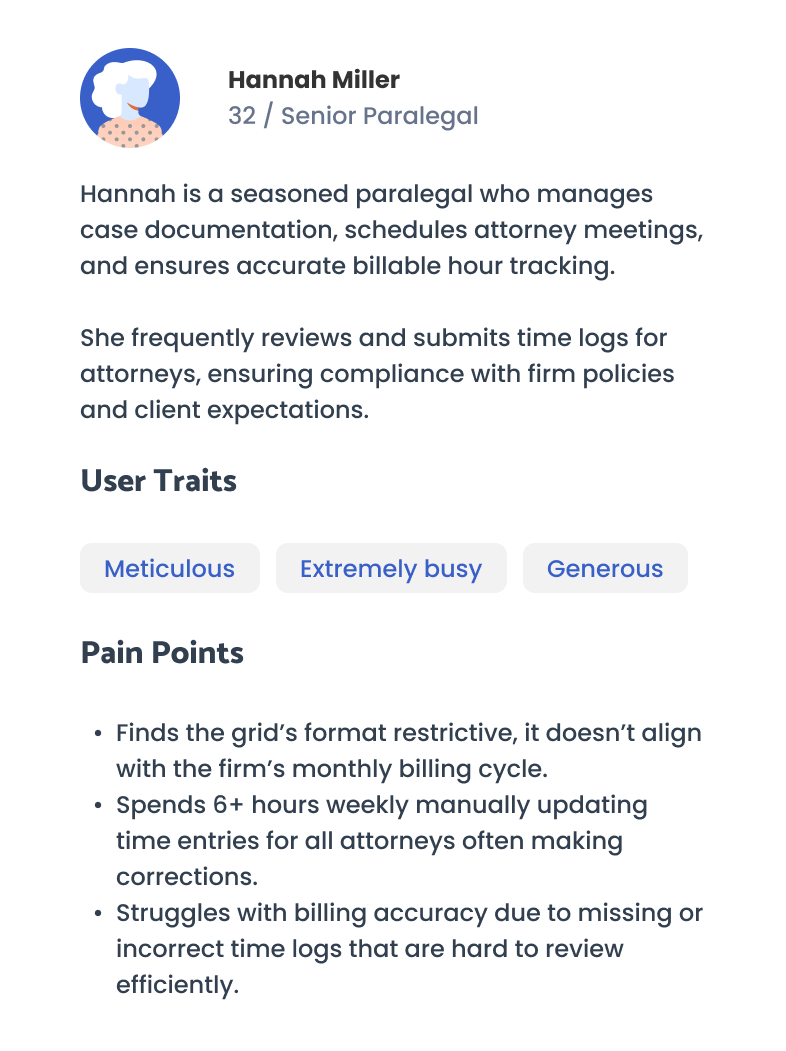
“Bulk editing would save me hours. Right now, it’s tedious to make changes one by one.”
— Hannah Miller , Senior Paralegal
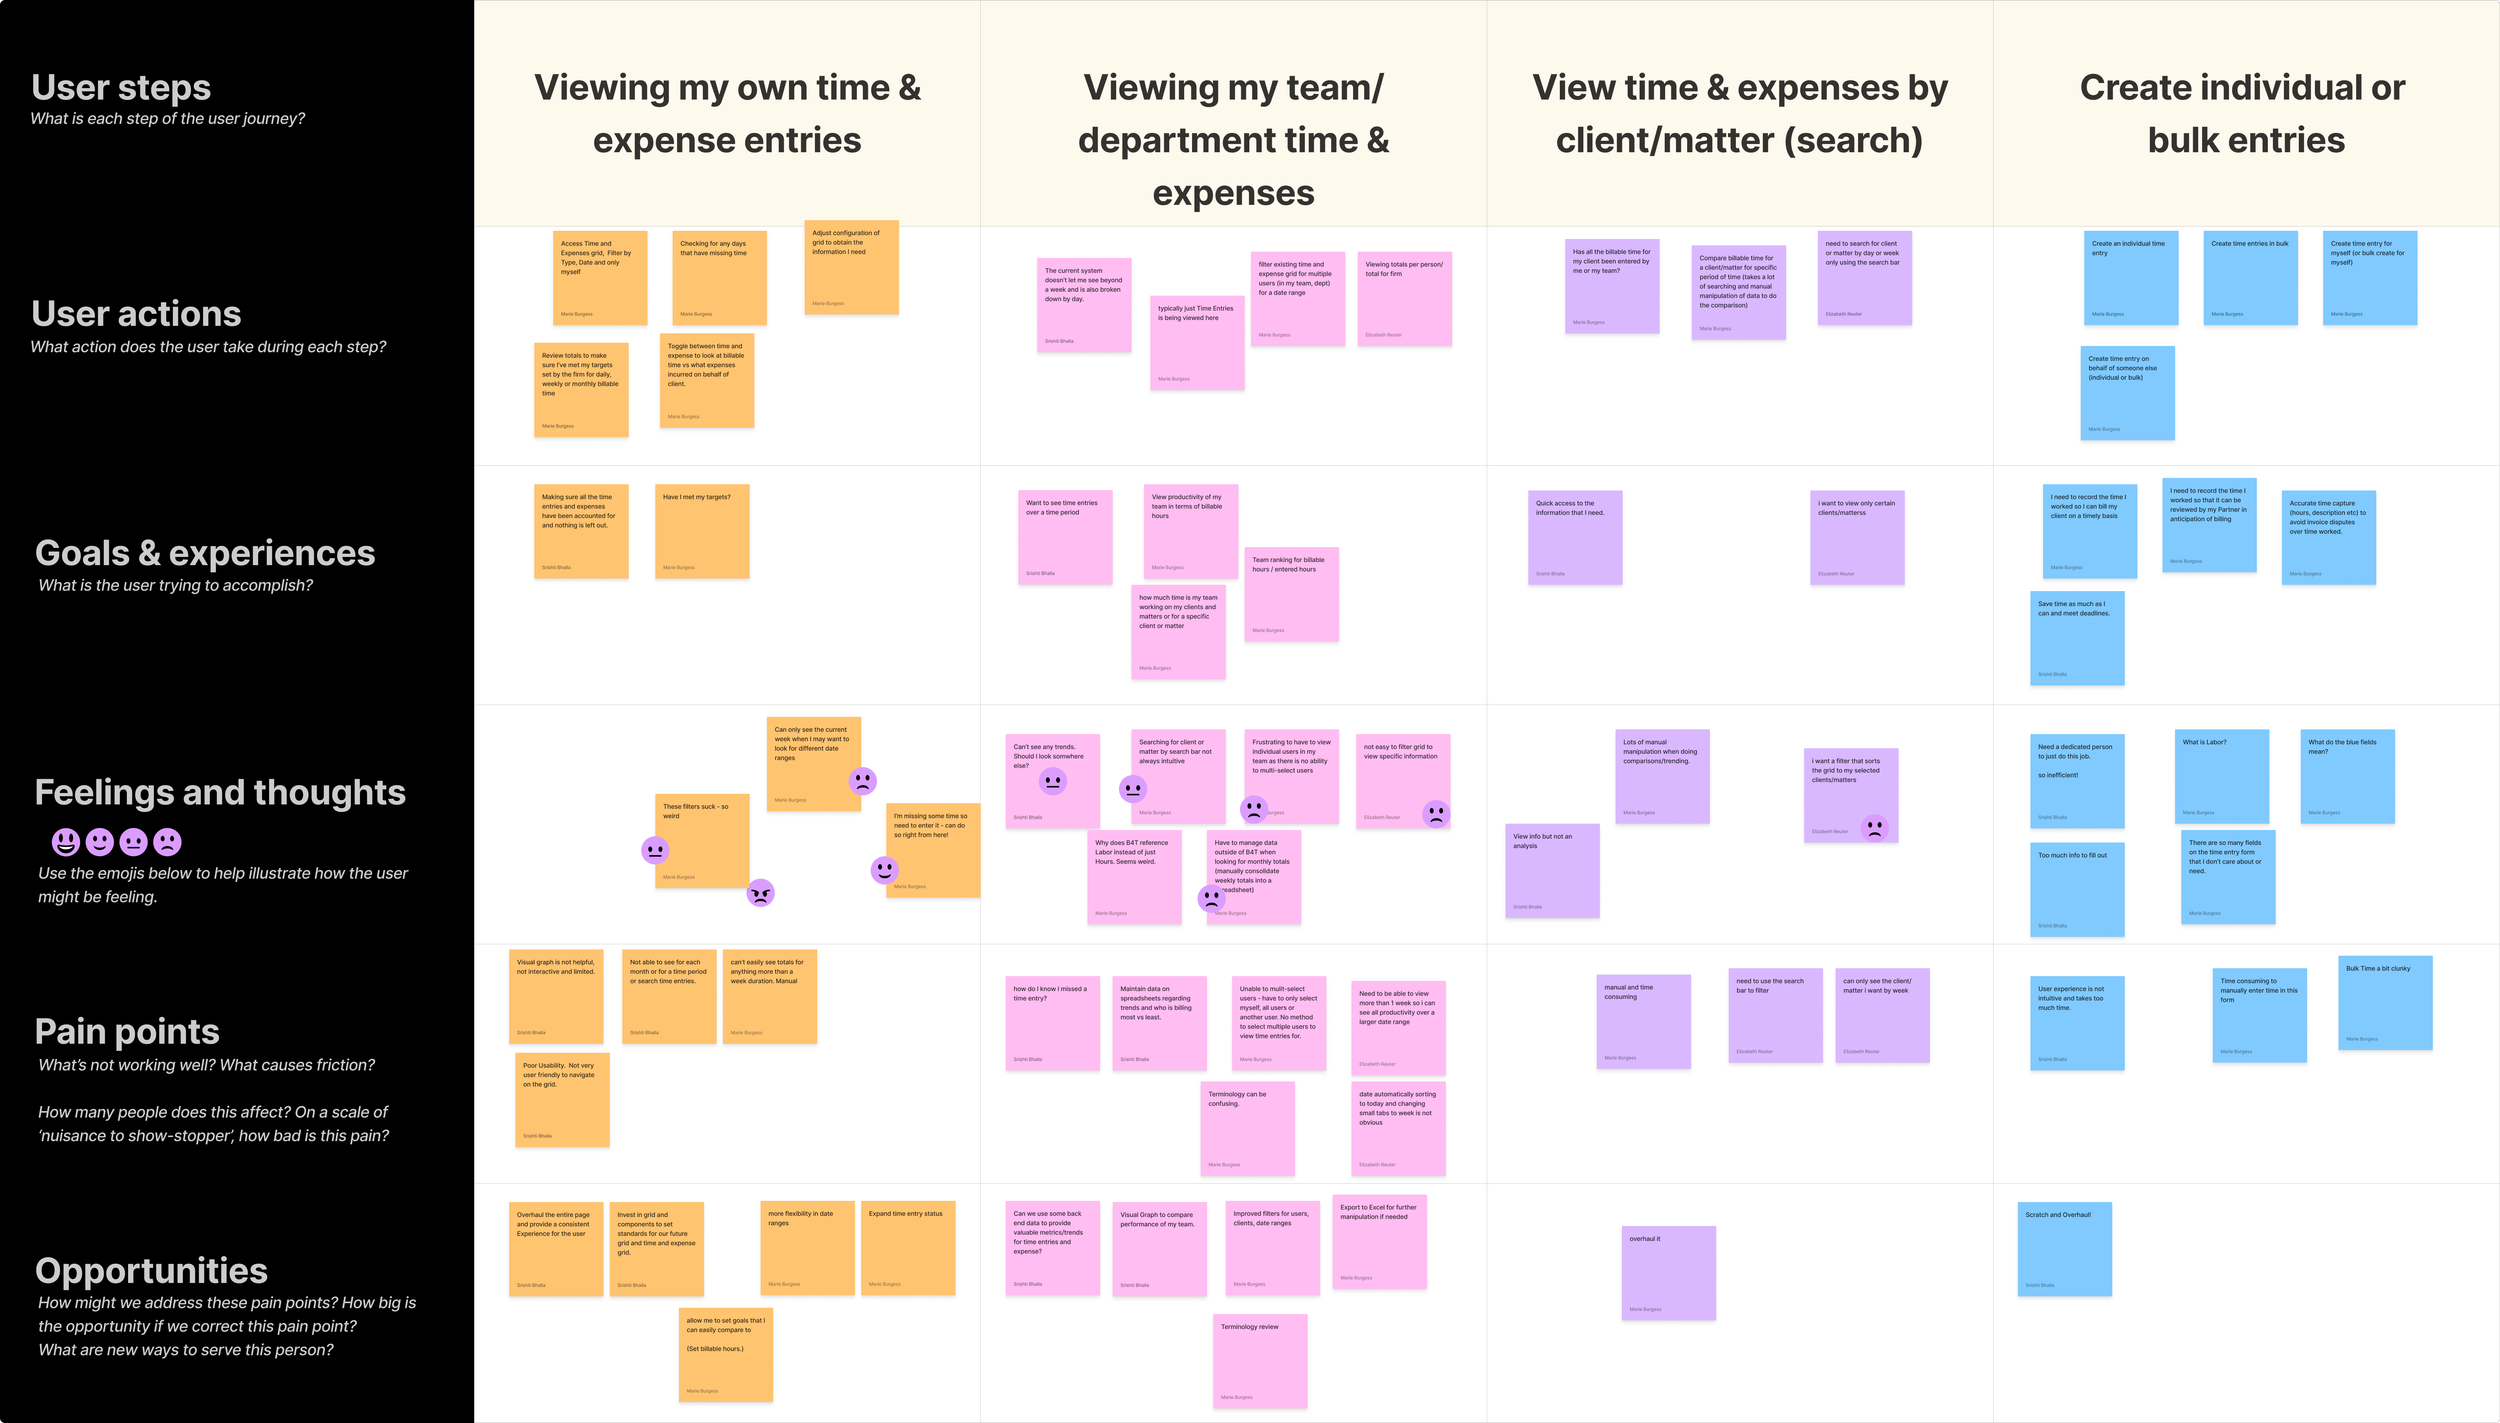
Mapping the user’s journey
We created a user journey map to visualize pain points across their workflow. Key friction points included:
Time lost manually tracking and recalculating monthly totals.
Confusion over billed vs. unbilled entries.
Limited flexibility in viewing team or multi-user data.
Competitive Benchmarking
We studied our competitors in the Legal Tech industry like Clio, MyCase, Caret Legal, Cosmolex) and found industry norms that Bill4Time lacked.

Key Insights & Direction

Monthly visibility is critical
Lawyers needed a monthly calendar view to see if they were meeting billable; targets something the old weekly grid couldn’t deliver.
Manual processes waste time
Users spent 5+ hours each week chasing, editing, and recalculating time entries; hurting productivity and adoption.

Accuracy before invoicing
Attorneys handling multiple matters required a clear way to review and confirm hours before billing to avoid errors.

Bulk editting for efficiency
The ability to update multiple entries at once was a must-have. Without it, users faced tedious, repetitive work.
What we didn’t build for our MVP (yet)

Automatic Time Capture
Although highly requested, automated time capture was excluded from the MVP due to scope and timeline constraints. Instead, we focused on improving the existing experience with more intuitive design and streamlined time and billing workflows.
Generating Iterations
To meet tight deadlines, we prioritized rapid iteration, starting with high-fidelity mocks. I created iterations for both Time Calendar View as well as Time and Expense Grid.
Iteration 1 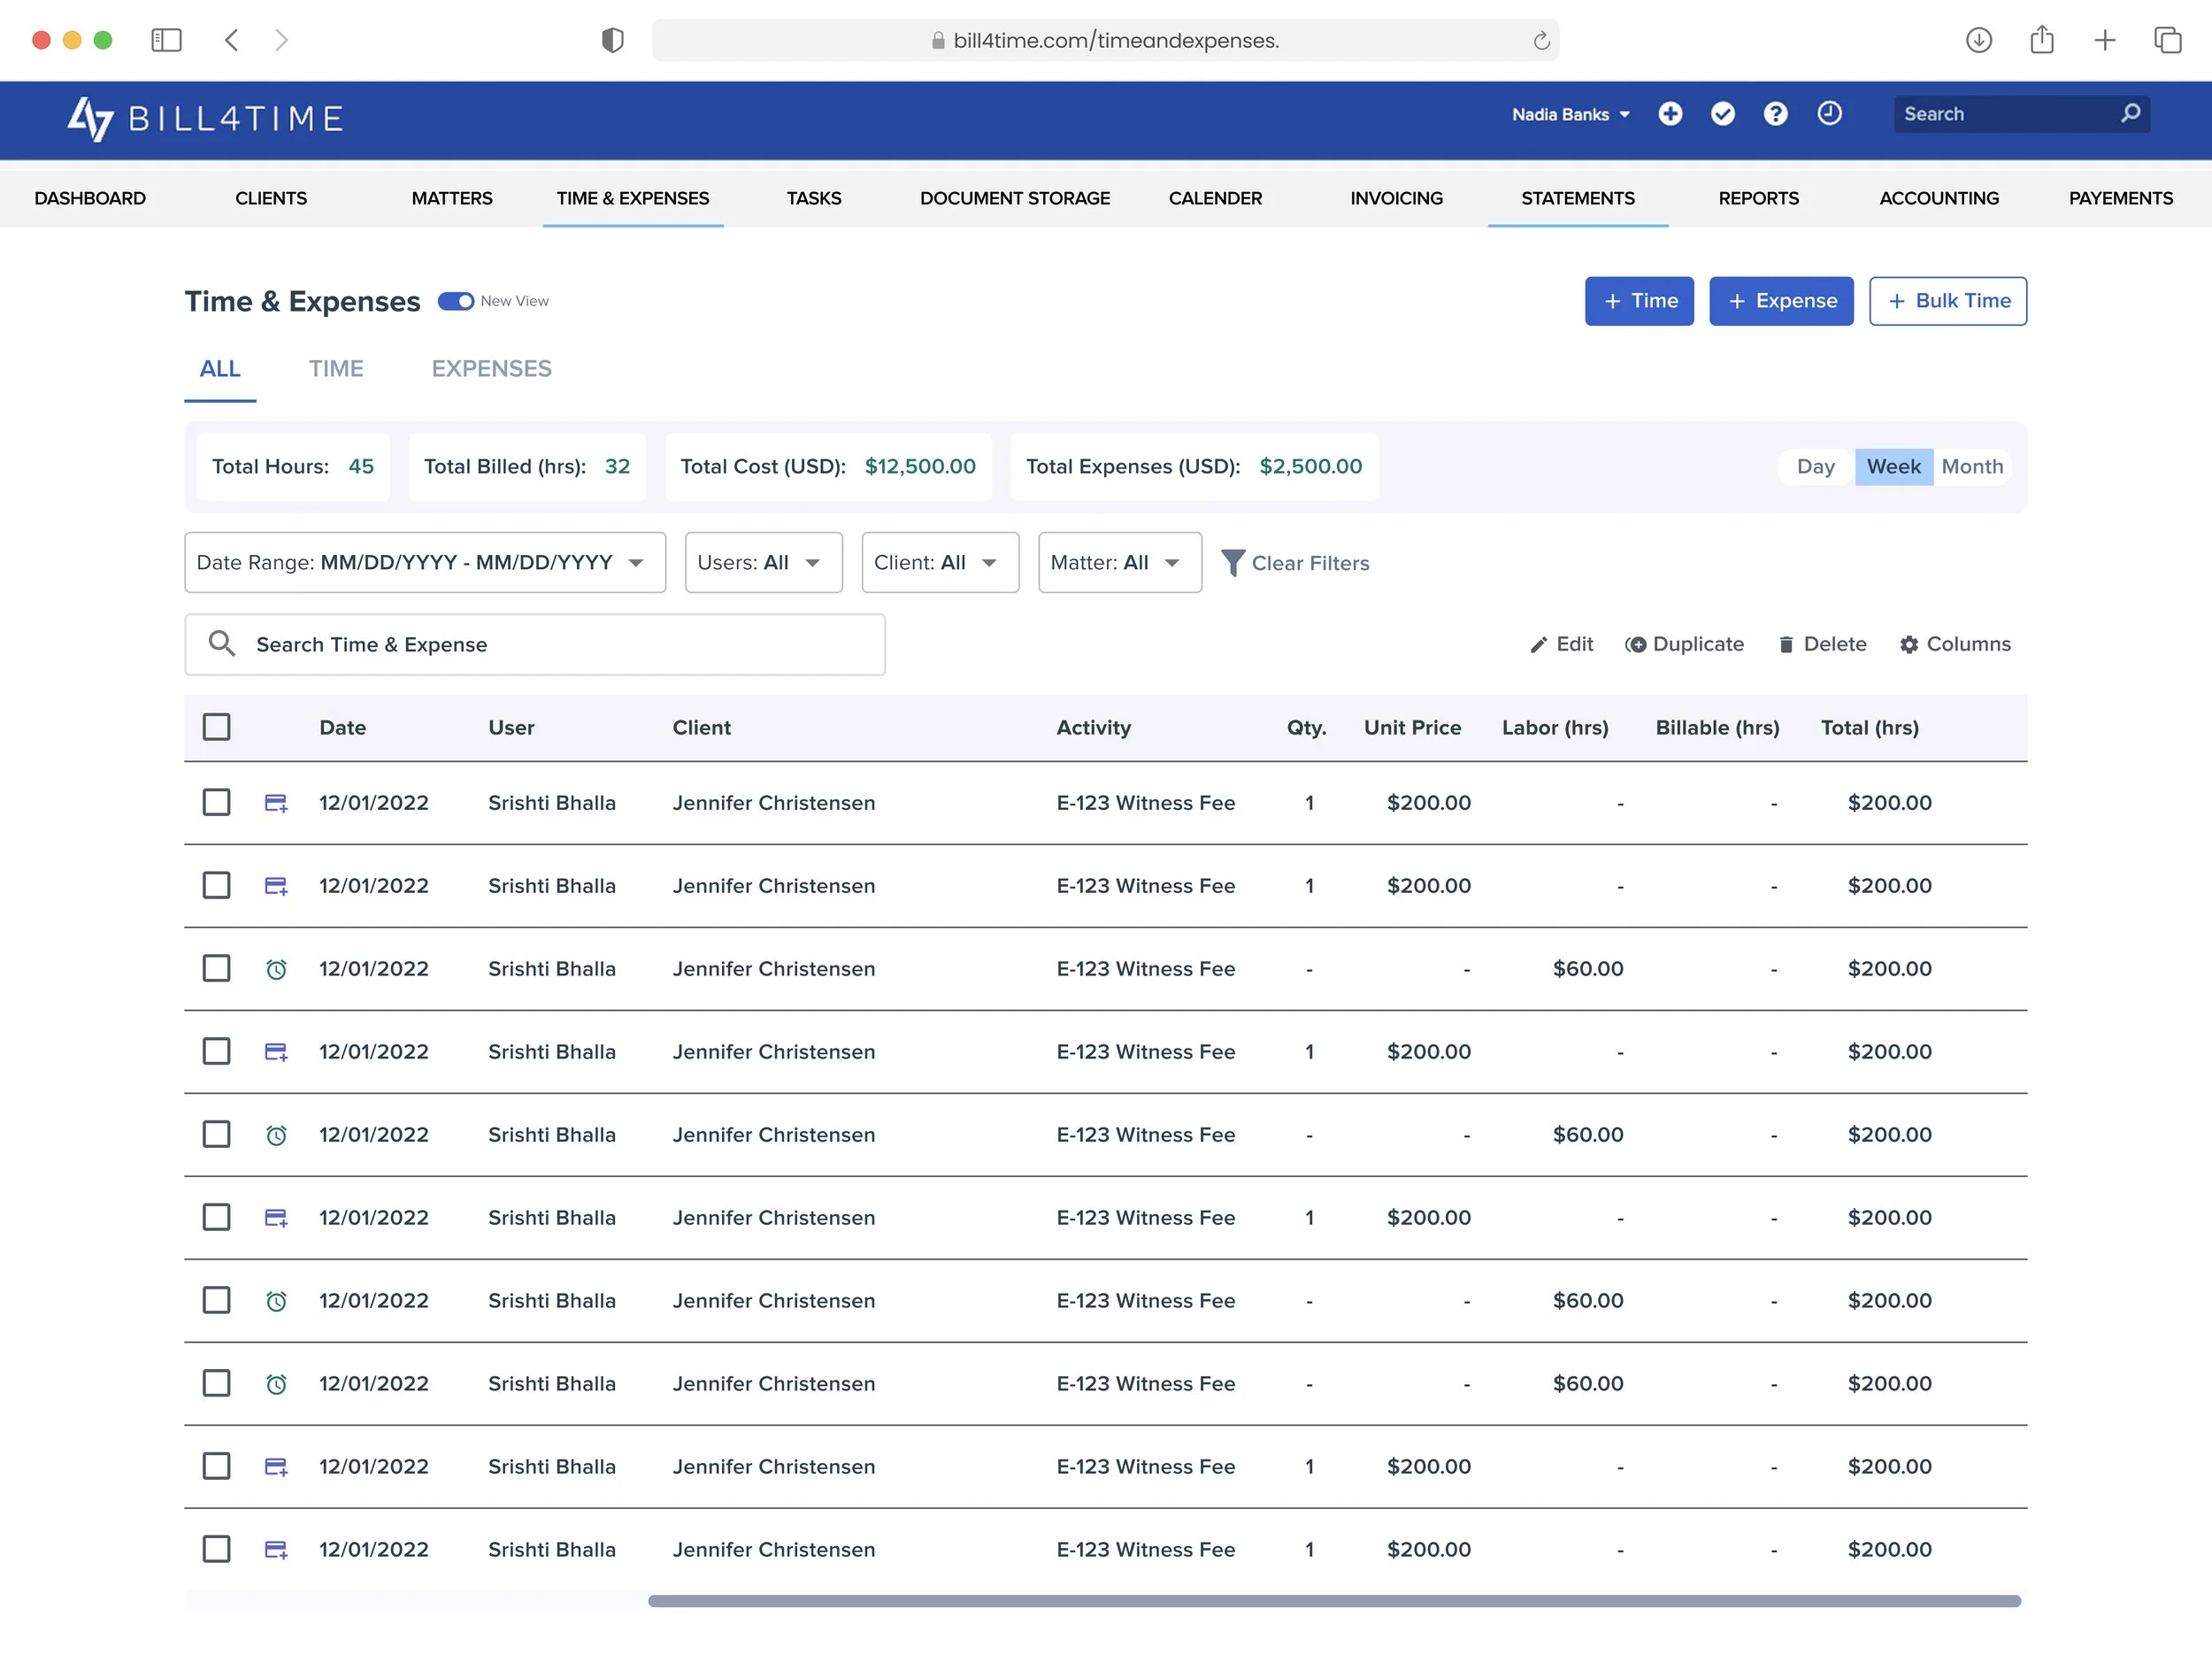
Iteration 1 – Grid with Existing Filters
Insight
Users appreciated having totals for hours, costs, and billing displayed at the top of the grid. Inspiration from our sibling product Practice Panther validated this approach. Bulk actions positioned at the top left also matched user expectations.
Action
Created a grid-based view with existing filters, adding a summary insights section on top for weekly/monthly totals. Positioned bulk actions clearly at the top of the grid for visibility.
Takeaway
While the summary insights worked well, the old filter design consumed too much real estate, cluttering the interface.
✅ Clear totals overview
✅ Familiar bulk actions placement
❌ Filters took up excessive space
Iteration 1.a 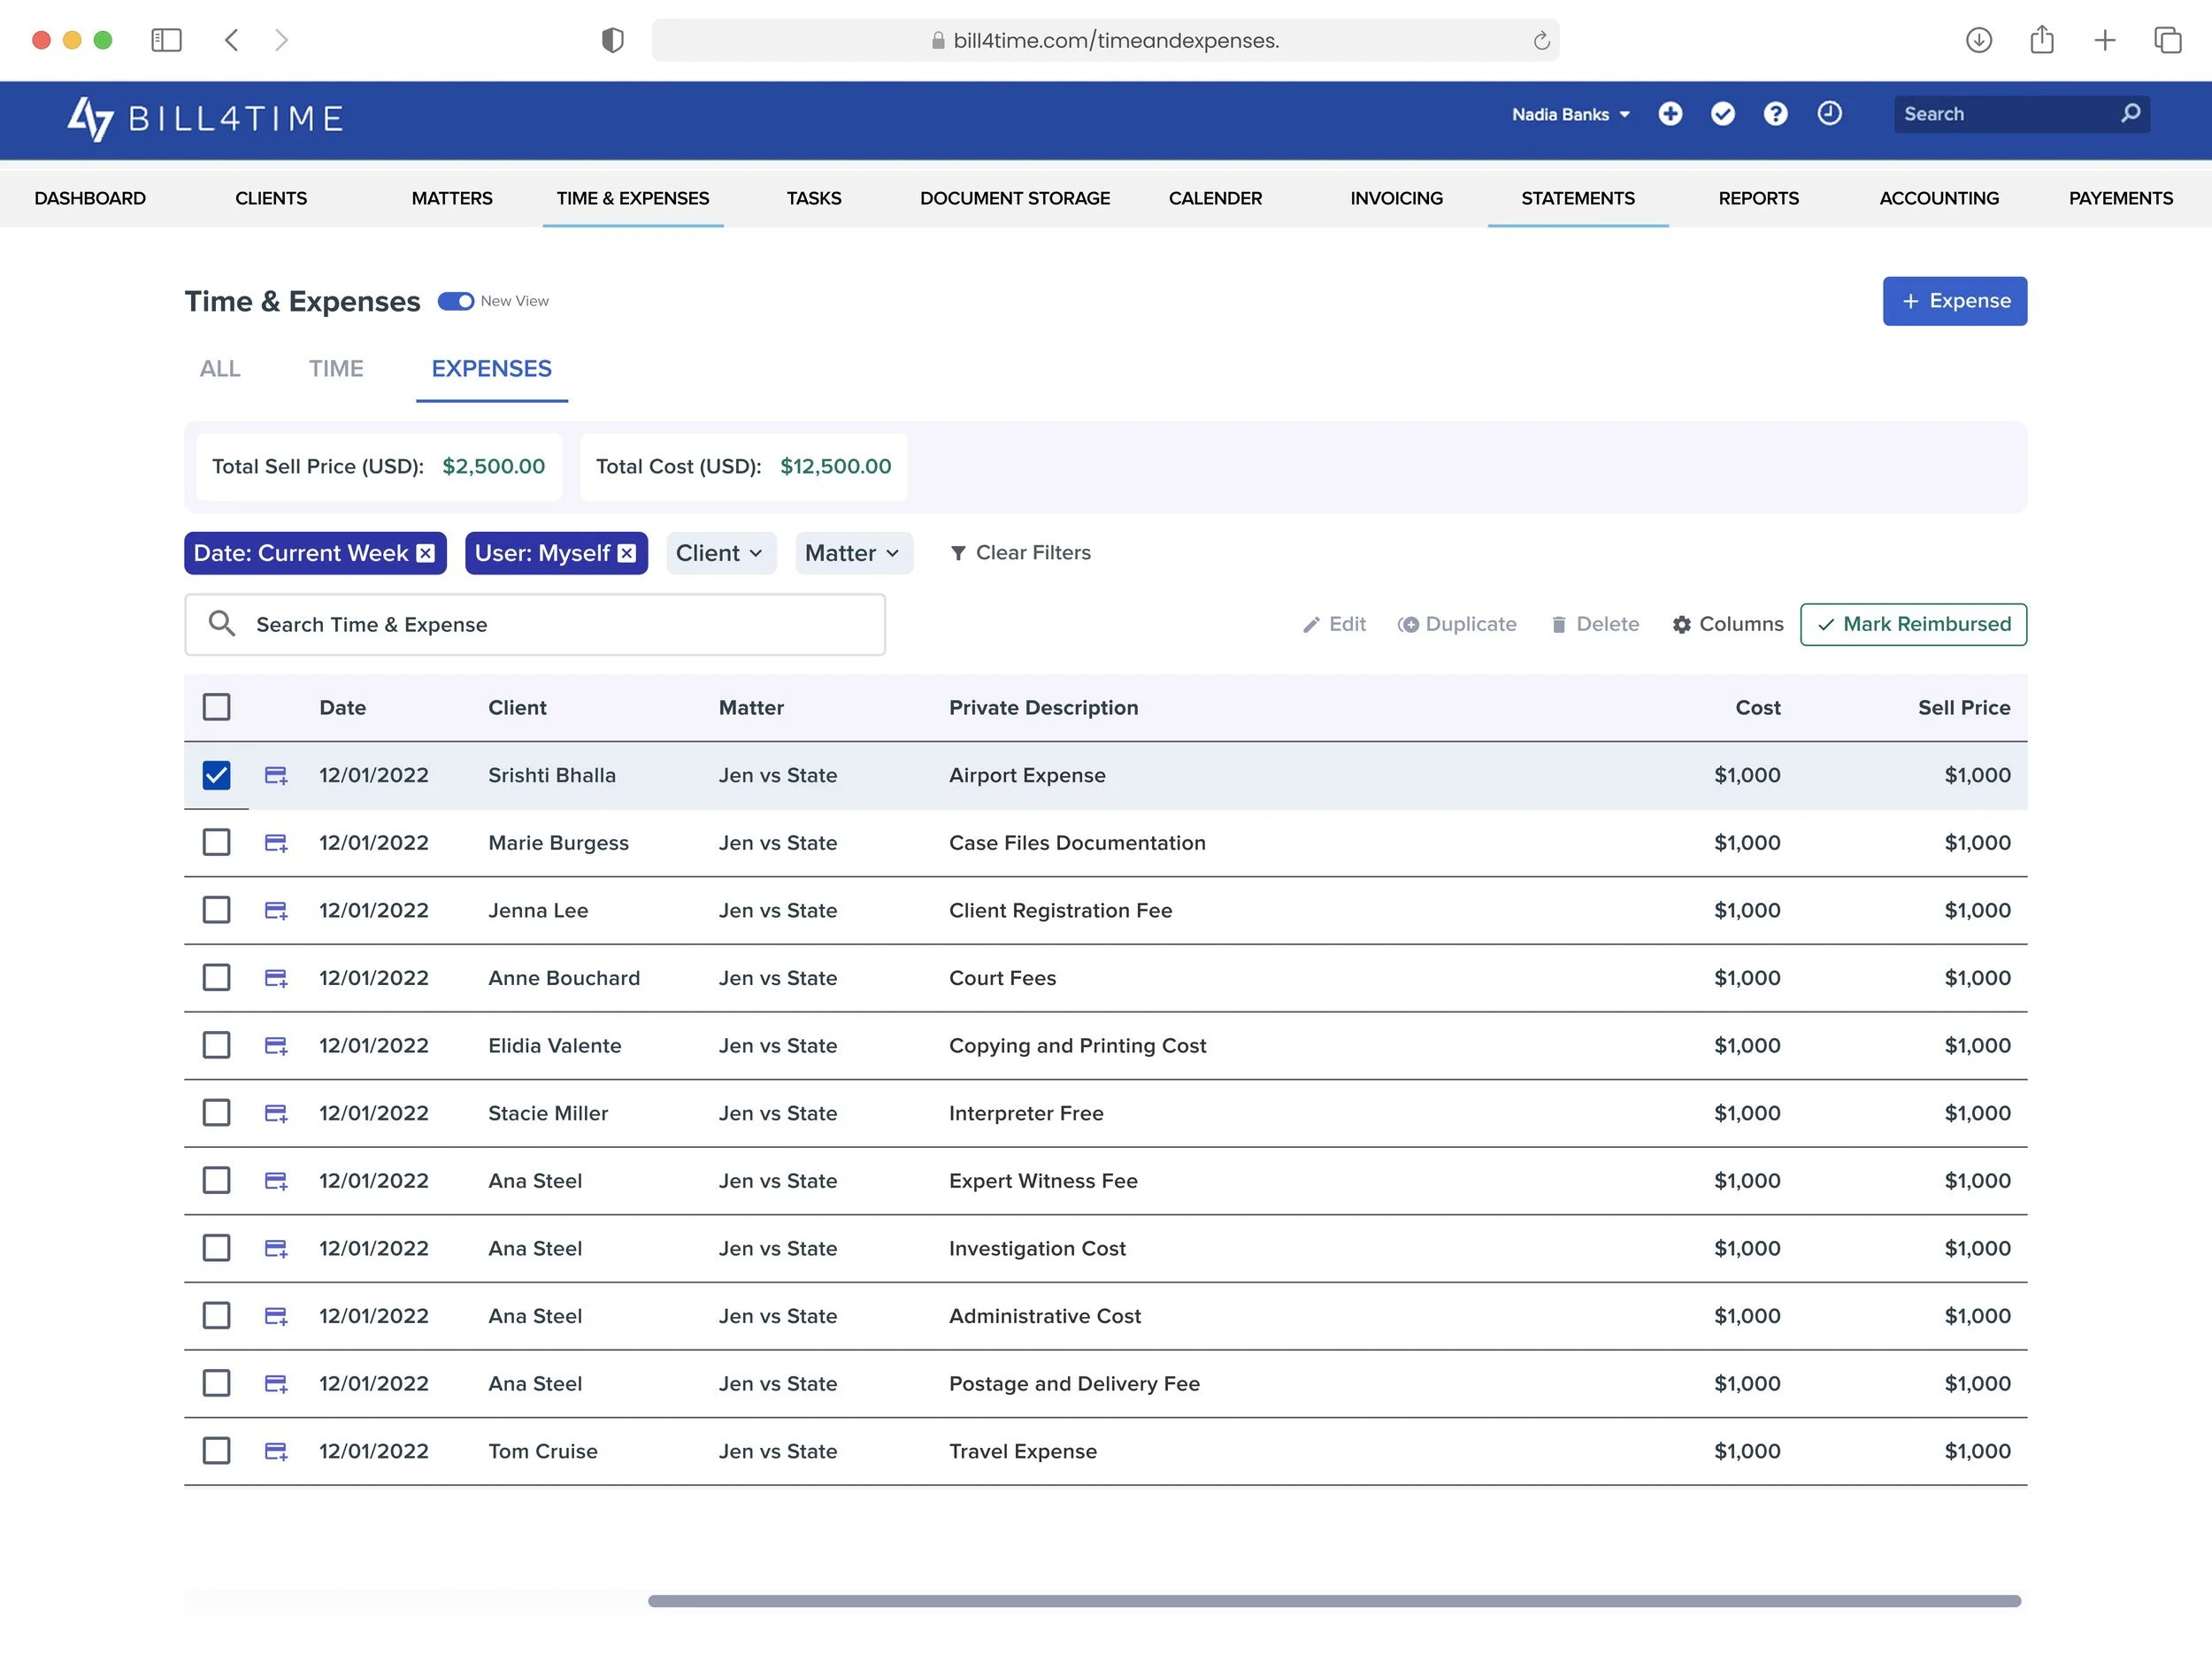
Iteration 1.A – Expenses Tab with Reimbursement
Insight
Users needed a clearer separation between time entries and expenses. Some still relied on the legacy “Mark Reimbursed” feature, but it wasn’t widely used across firms.
Action
Created a dedicated Expenses tab for a more focused view. Added “Mark Reimbursed” as an option to test whether it was still valuable. Tried new Filters style.
Takeaway
Separating views improved clarity, but niche features like reimbursement didn’t justify MVP scope. We chose to prioritize core workflows first.
✅ Clearer split between time and expenses
❌ Reimbursement wasn’t essential for MVP, but we needed to test it.
Iteration 2
Insight
Users liked the idea of a calendar overview but found several points confusing:
Non-billable hours were labeled “Labour Hours,” causing misinterpretation.
Weekly totals showed under Saturday, which conflicted with how some lawyers worked weekends.
Holidays marked as “No Hours” in red looked like an error instead of intentional.
Action
Created a calendar view with a legend for billable, non-billable, and total hours. Added weekly totals, but reserved Saturday for them. Began exploring filters by user/attorney for more flexibility.
Takeaway
The calendar provided at-a-glance visibility but introduced terminology issues and placement confusion. Needed refinement before becoming MVP-ready.
✅ Clear legend for hour types
❌ Confusing terminology & Saturday totals
Iteration 2 – Time Calendar View
Iteration 2.A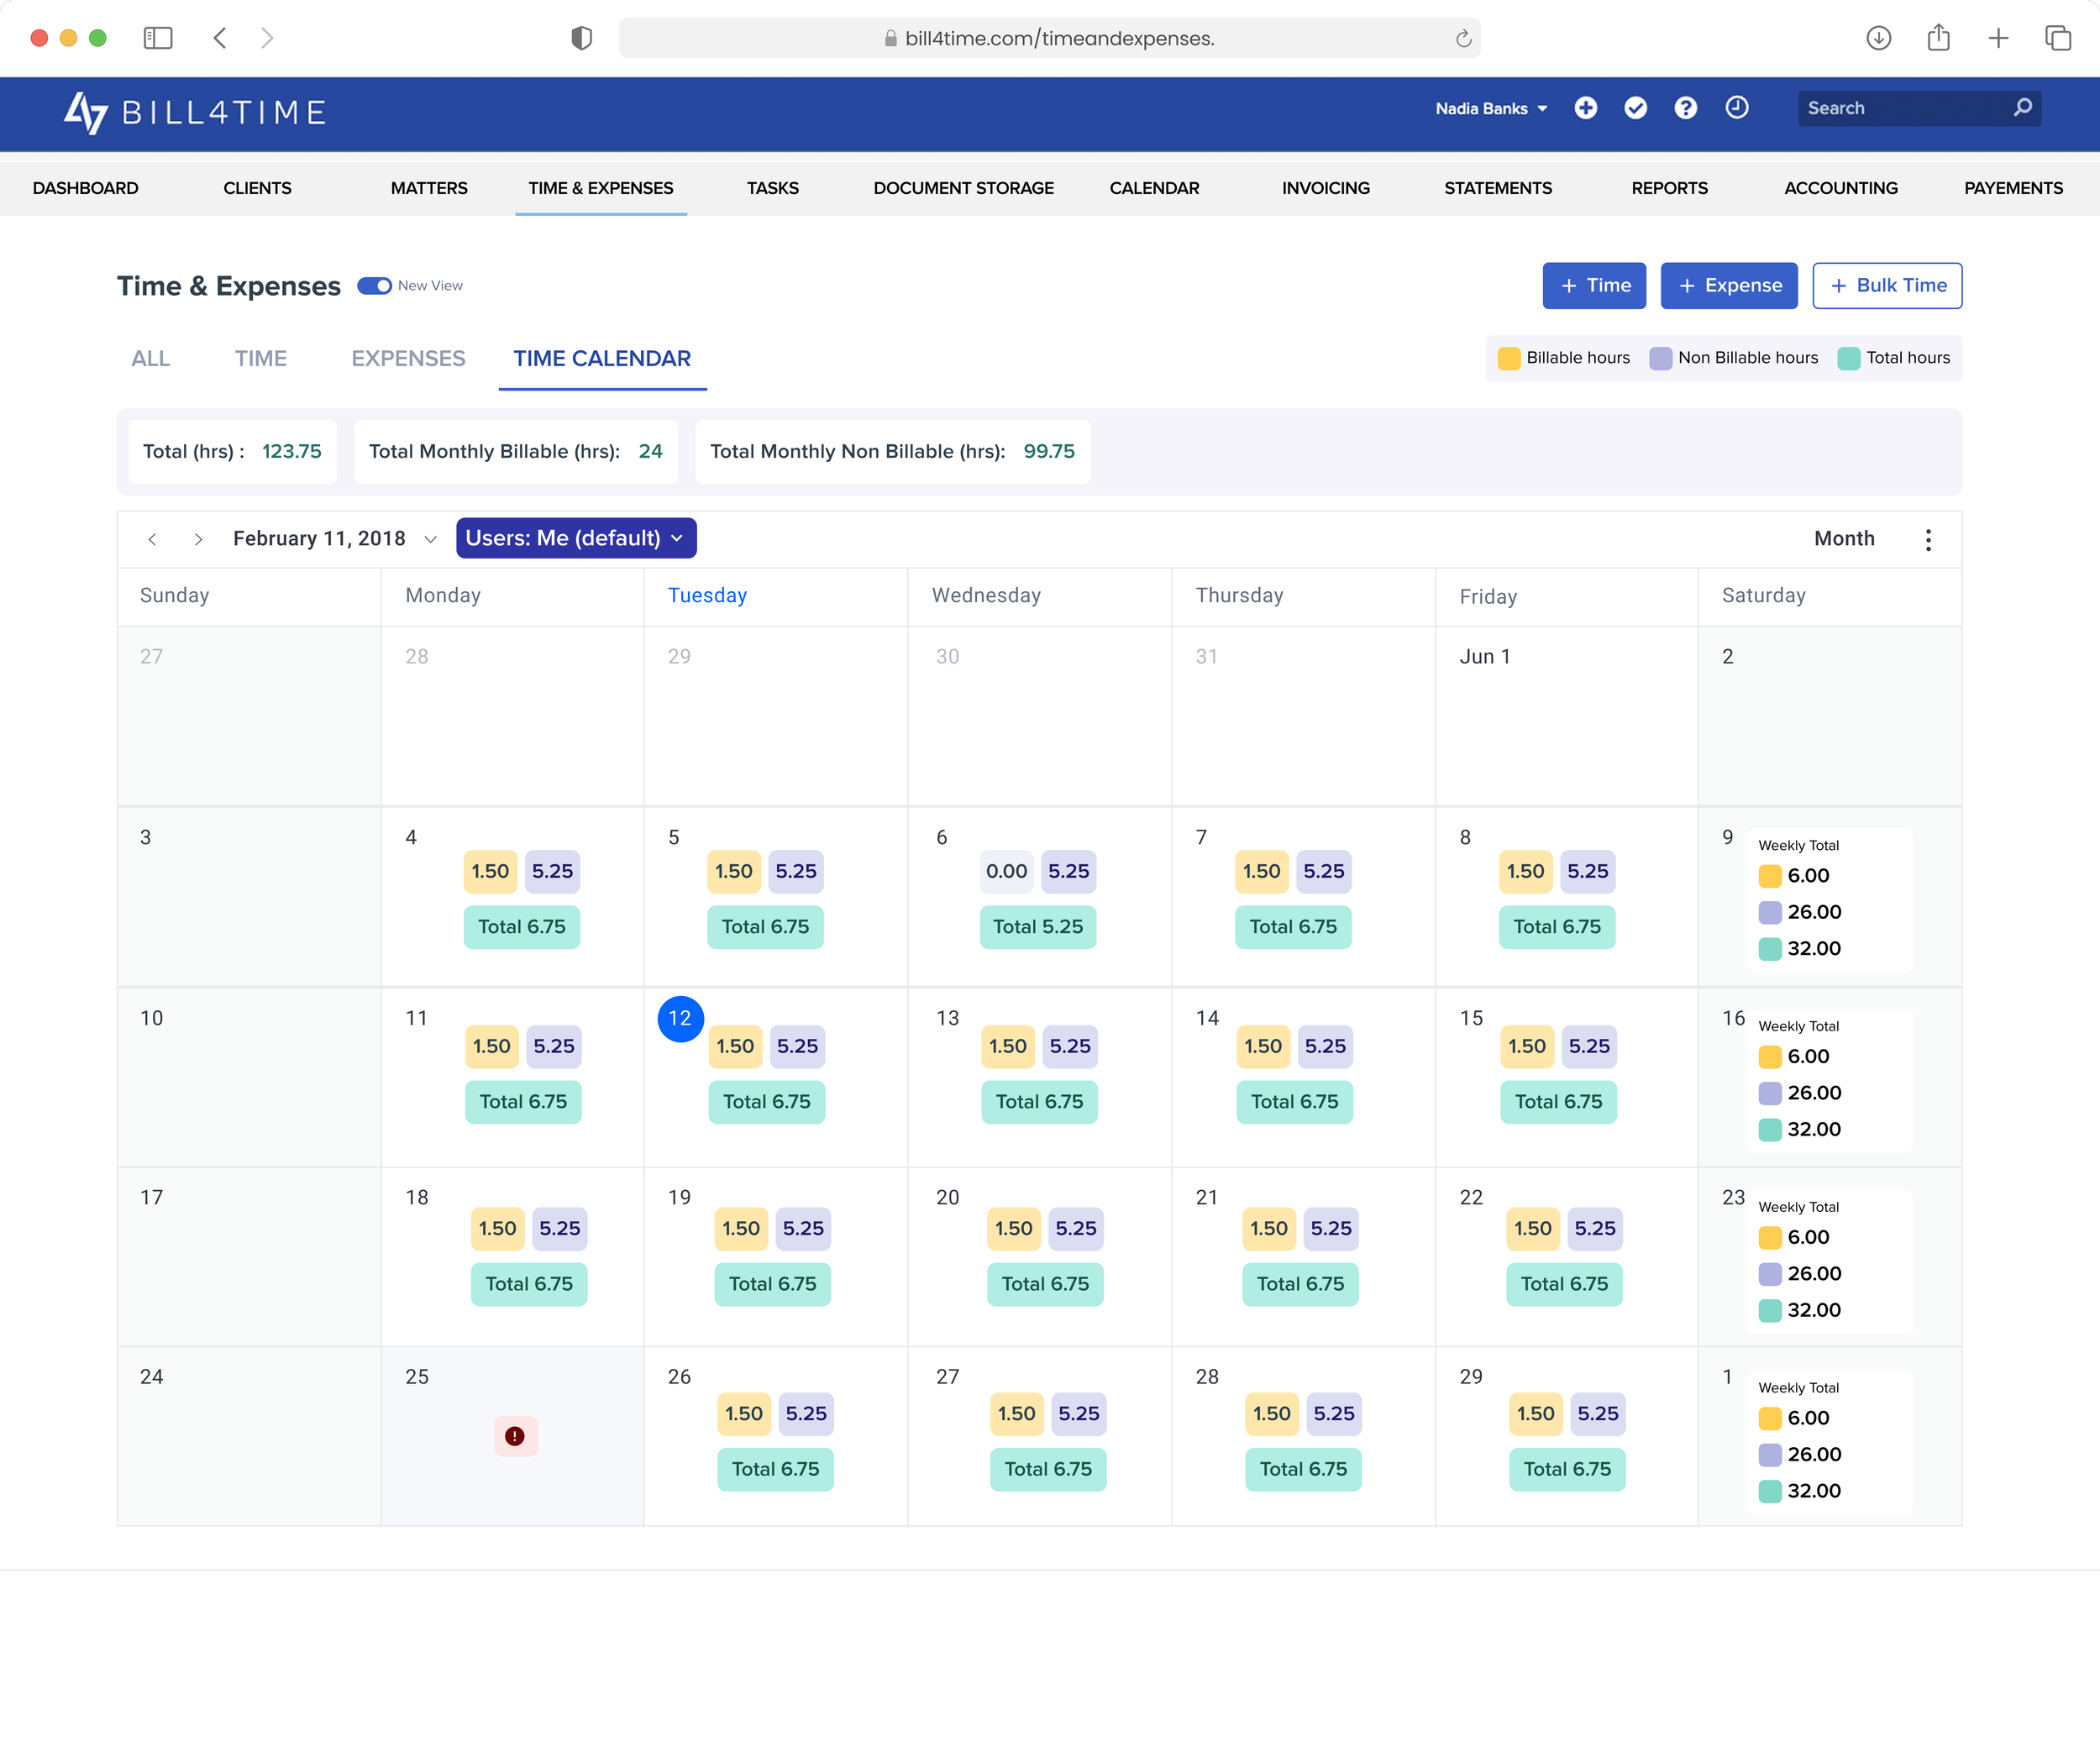
Iteration 2.A – Time Calendar with Totals & Filters
Insight
Users needed clearer visibility into weekly totals and the ability to filter by different users at a firm. This would make it easier for admins and partners to review workload distribution.
Action
Added a dedicated filter to toggle between users.
Introduced weekly totals directly in the calendar.
Moved monthly totals to the top for quick reference.
Takeaway
✅ Easier to view team workload and totals at different levels.
❌ Weekly totals still cluttered Saturdays.
❌ Too many competing colors reduced clarity.
Iteration 2.B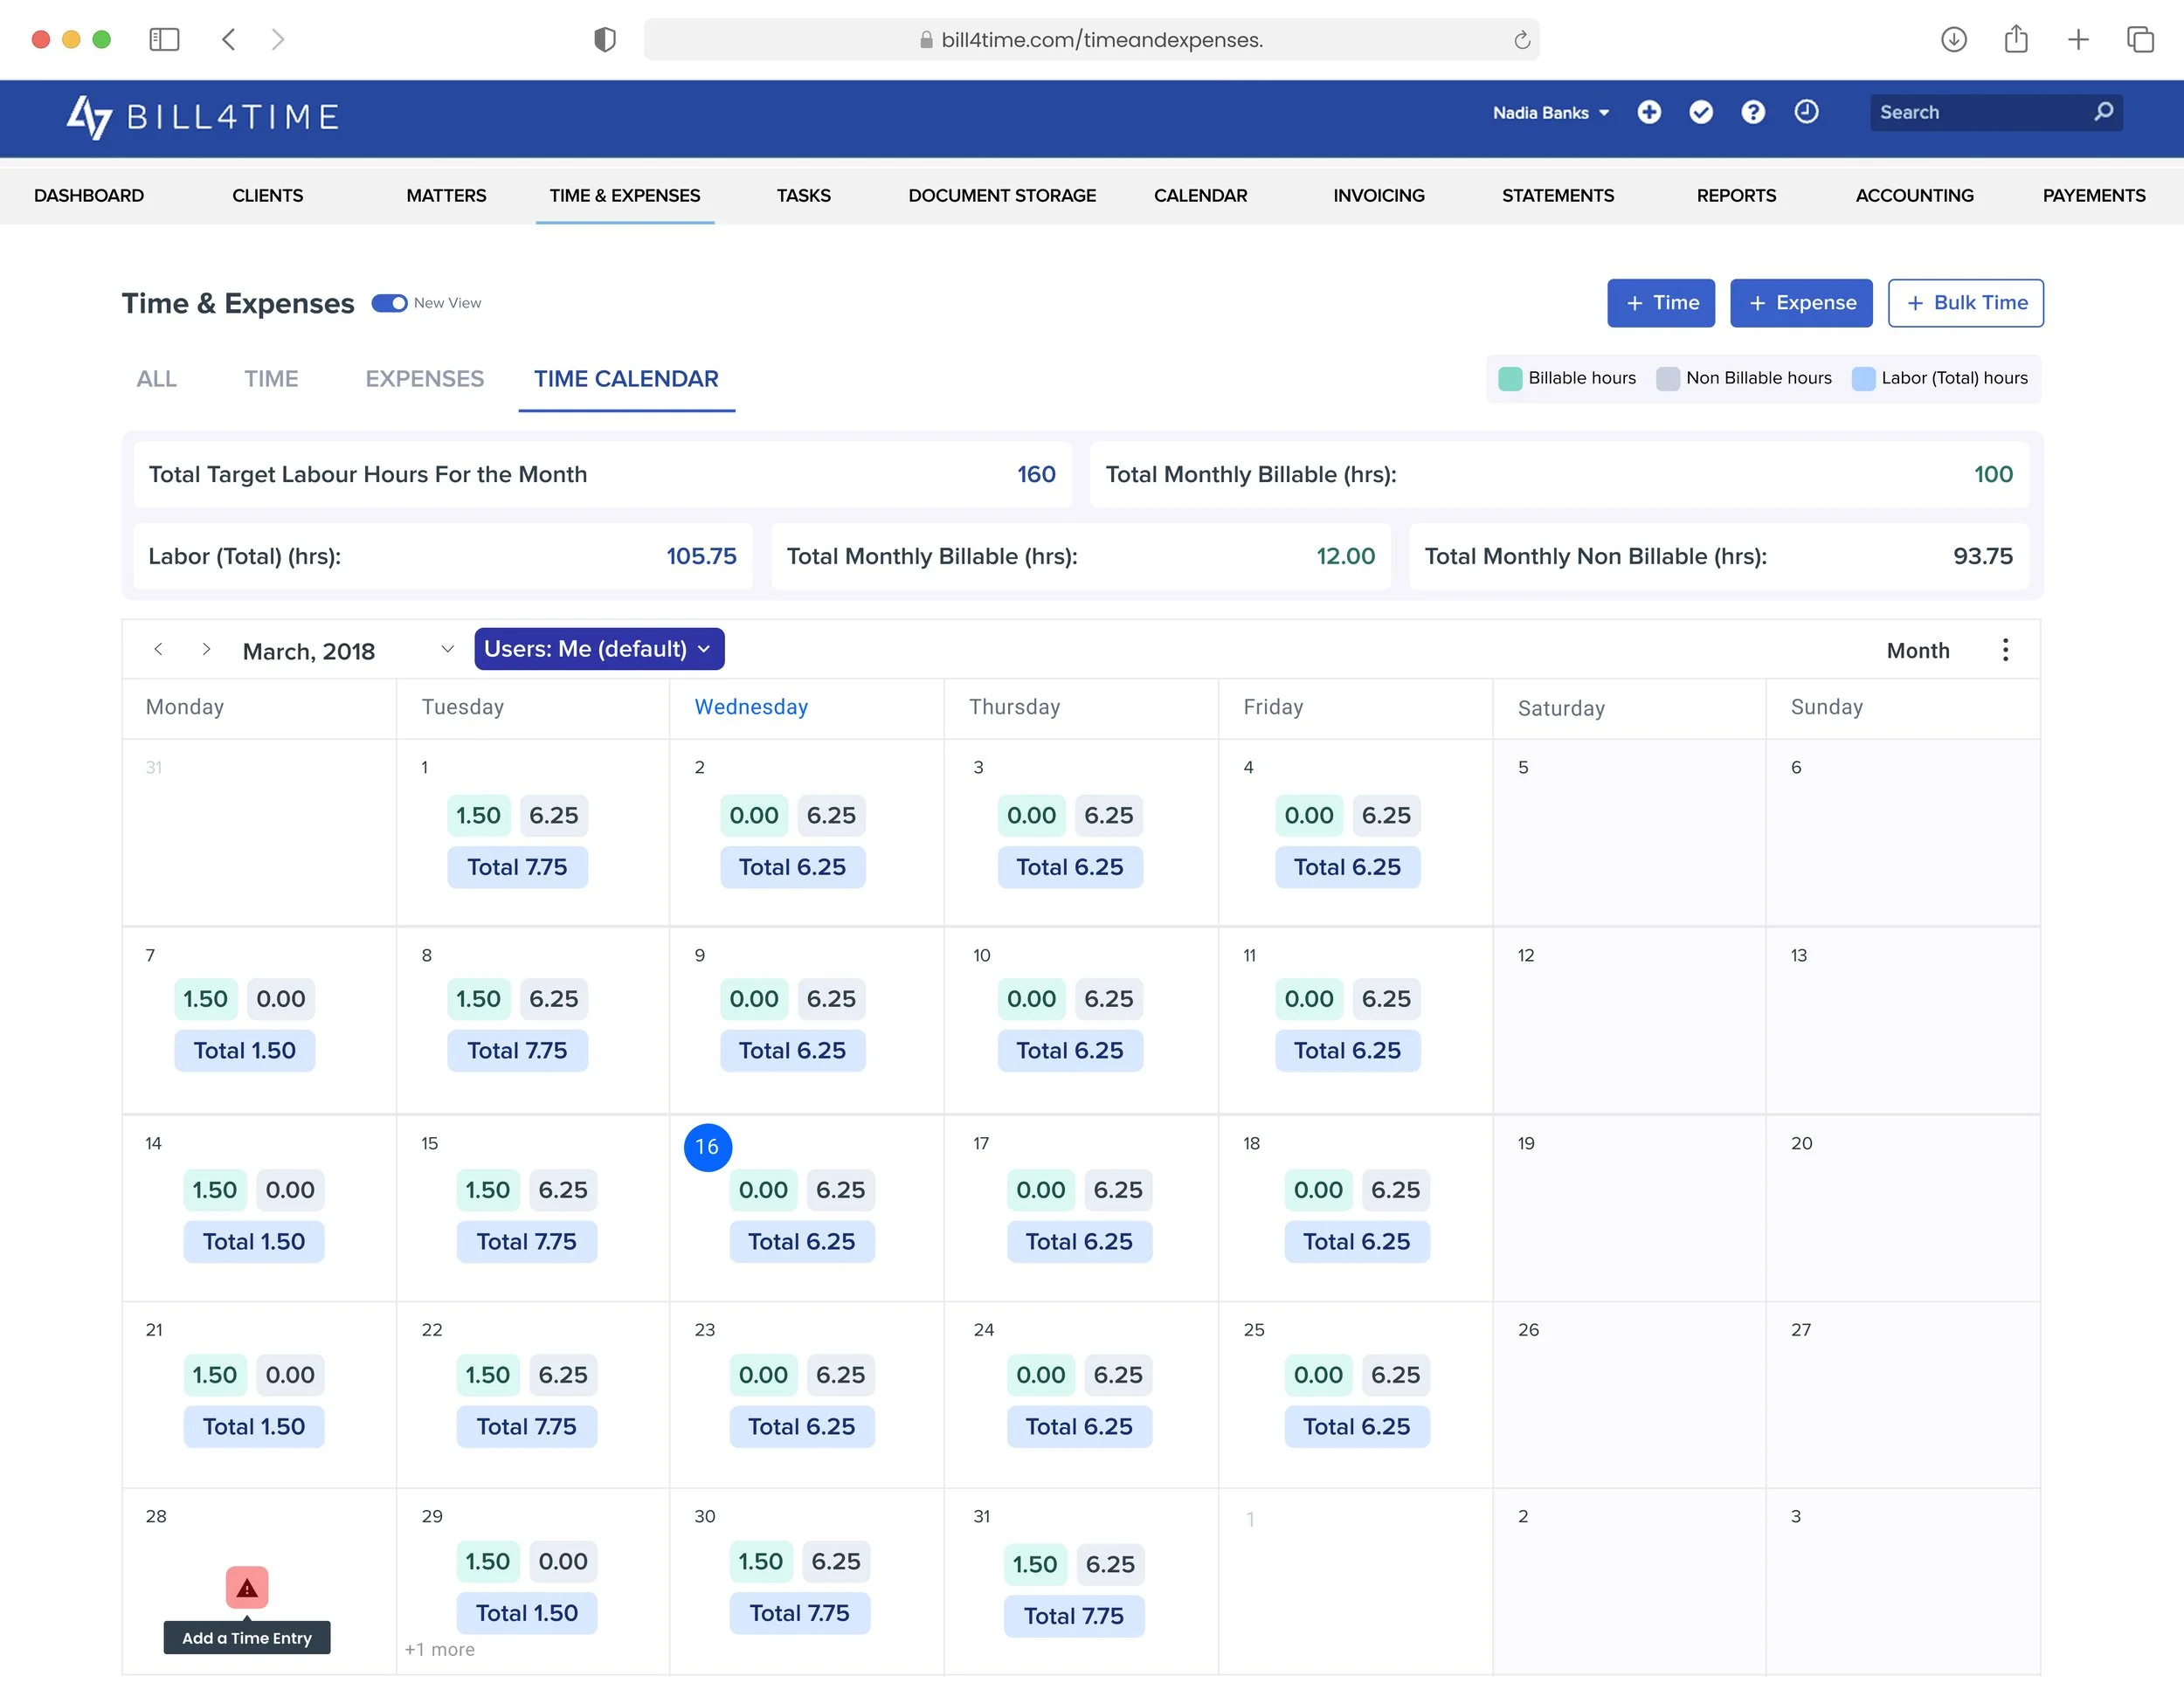
Iteration 2.B – Time Calendar with Target Hours and Refined Visual Cues
Insight
Users needed a way to track progress against target labor hours while still keeping billable hours visually distinct and easy to spot. This would help individuals and firms measure performance against goals.
Action
Introduced total target labor hours in the monthly totals.
Updated the color cues so billable hours stand out more clearly.
Kept non-billable and total hours subtle to reduce visual clutter.
Takeaway
✅ Gave users a benchmark for performance with target hours.
✅ Billable hours became more prominent and easier to scan.
❌ Some users still found the calendar visually dense.
❌ Target hours added extra complexity not all users needed.
Validating with Usability Tests
Usability Test A - Time Calendar (n = 45)
What we learned
✅ Users quickly understood monthly at-a-glance billable vs. non-billable hours.
❌ Weekly totals under Saturday felt confusing (especially for weekend work).
❌ Holiday states weren’t clear — red “no hours” looked like an error.
❌ Users wanted an easy way to spot missing entries.
❌ Some users didn’t understand “Target” since they weren’t actively using this feature in Bill4Time.
What we changed
Removed weekly totals from MVP (moved to future Week View release).
Adjusted holiday/no-entry to a neutral color state.
Replaced “labour hours” with clearer “non-billable hours.”
Added a quick cue for missed entries (clicking took users to the add entry modal).
Usability Test B - Time and Expenses (n = 34)

What we learned
❌ Grid felt dense; description column too small for longer notes.
❌ Time/Expense filters weren’t visible enough.
❌ Long dropdowns slowed users; needed faster selection.
✅ Bulk actions (duplicate/update) were useful.
❌ “Mark Reimbursed” was less critical.
What we changed
Increased spacing and made description columns wider.
Redesigned filters and kept them always visible for quick access.
Added type-ahead search in dropdowns for faster filtering.
Removed “Mark Reimbursed” from MVP.
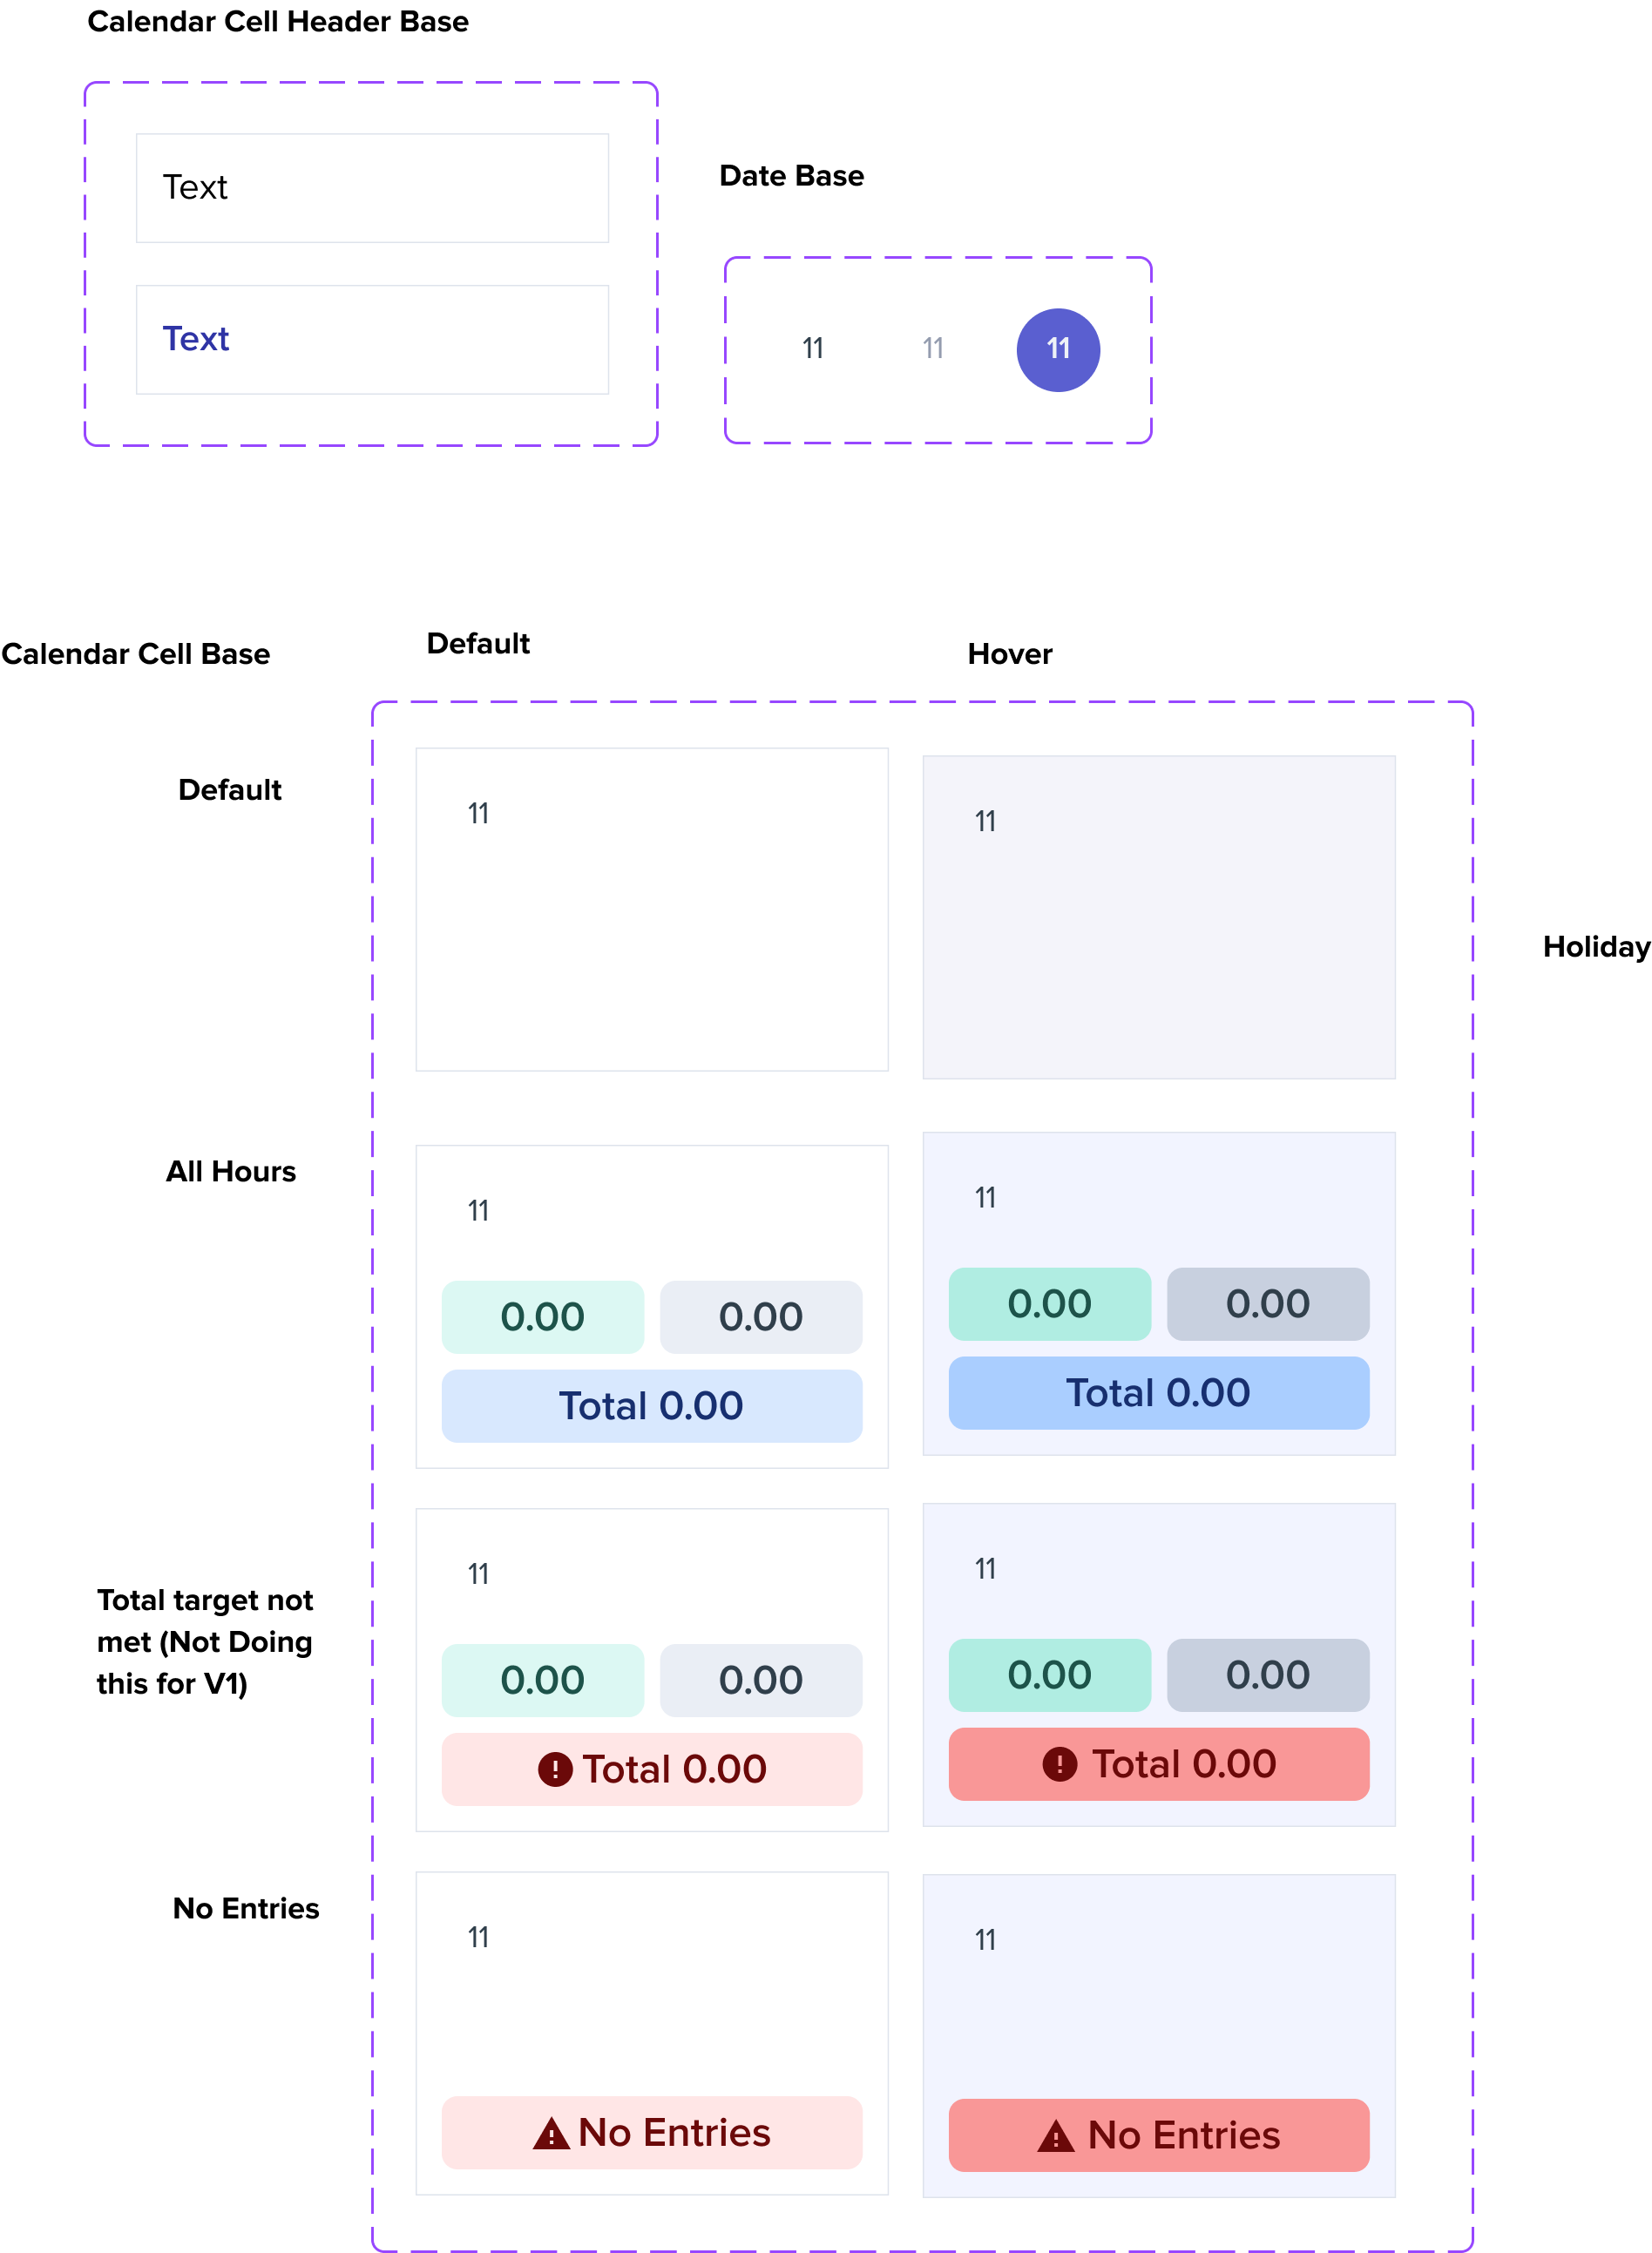
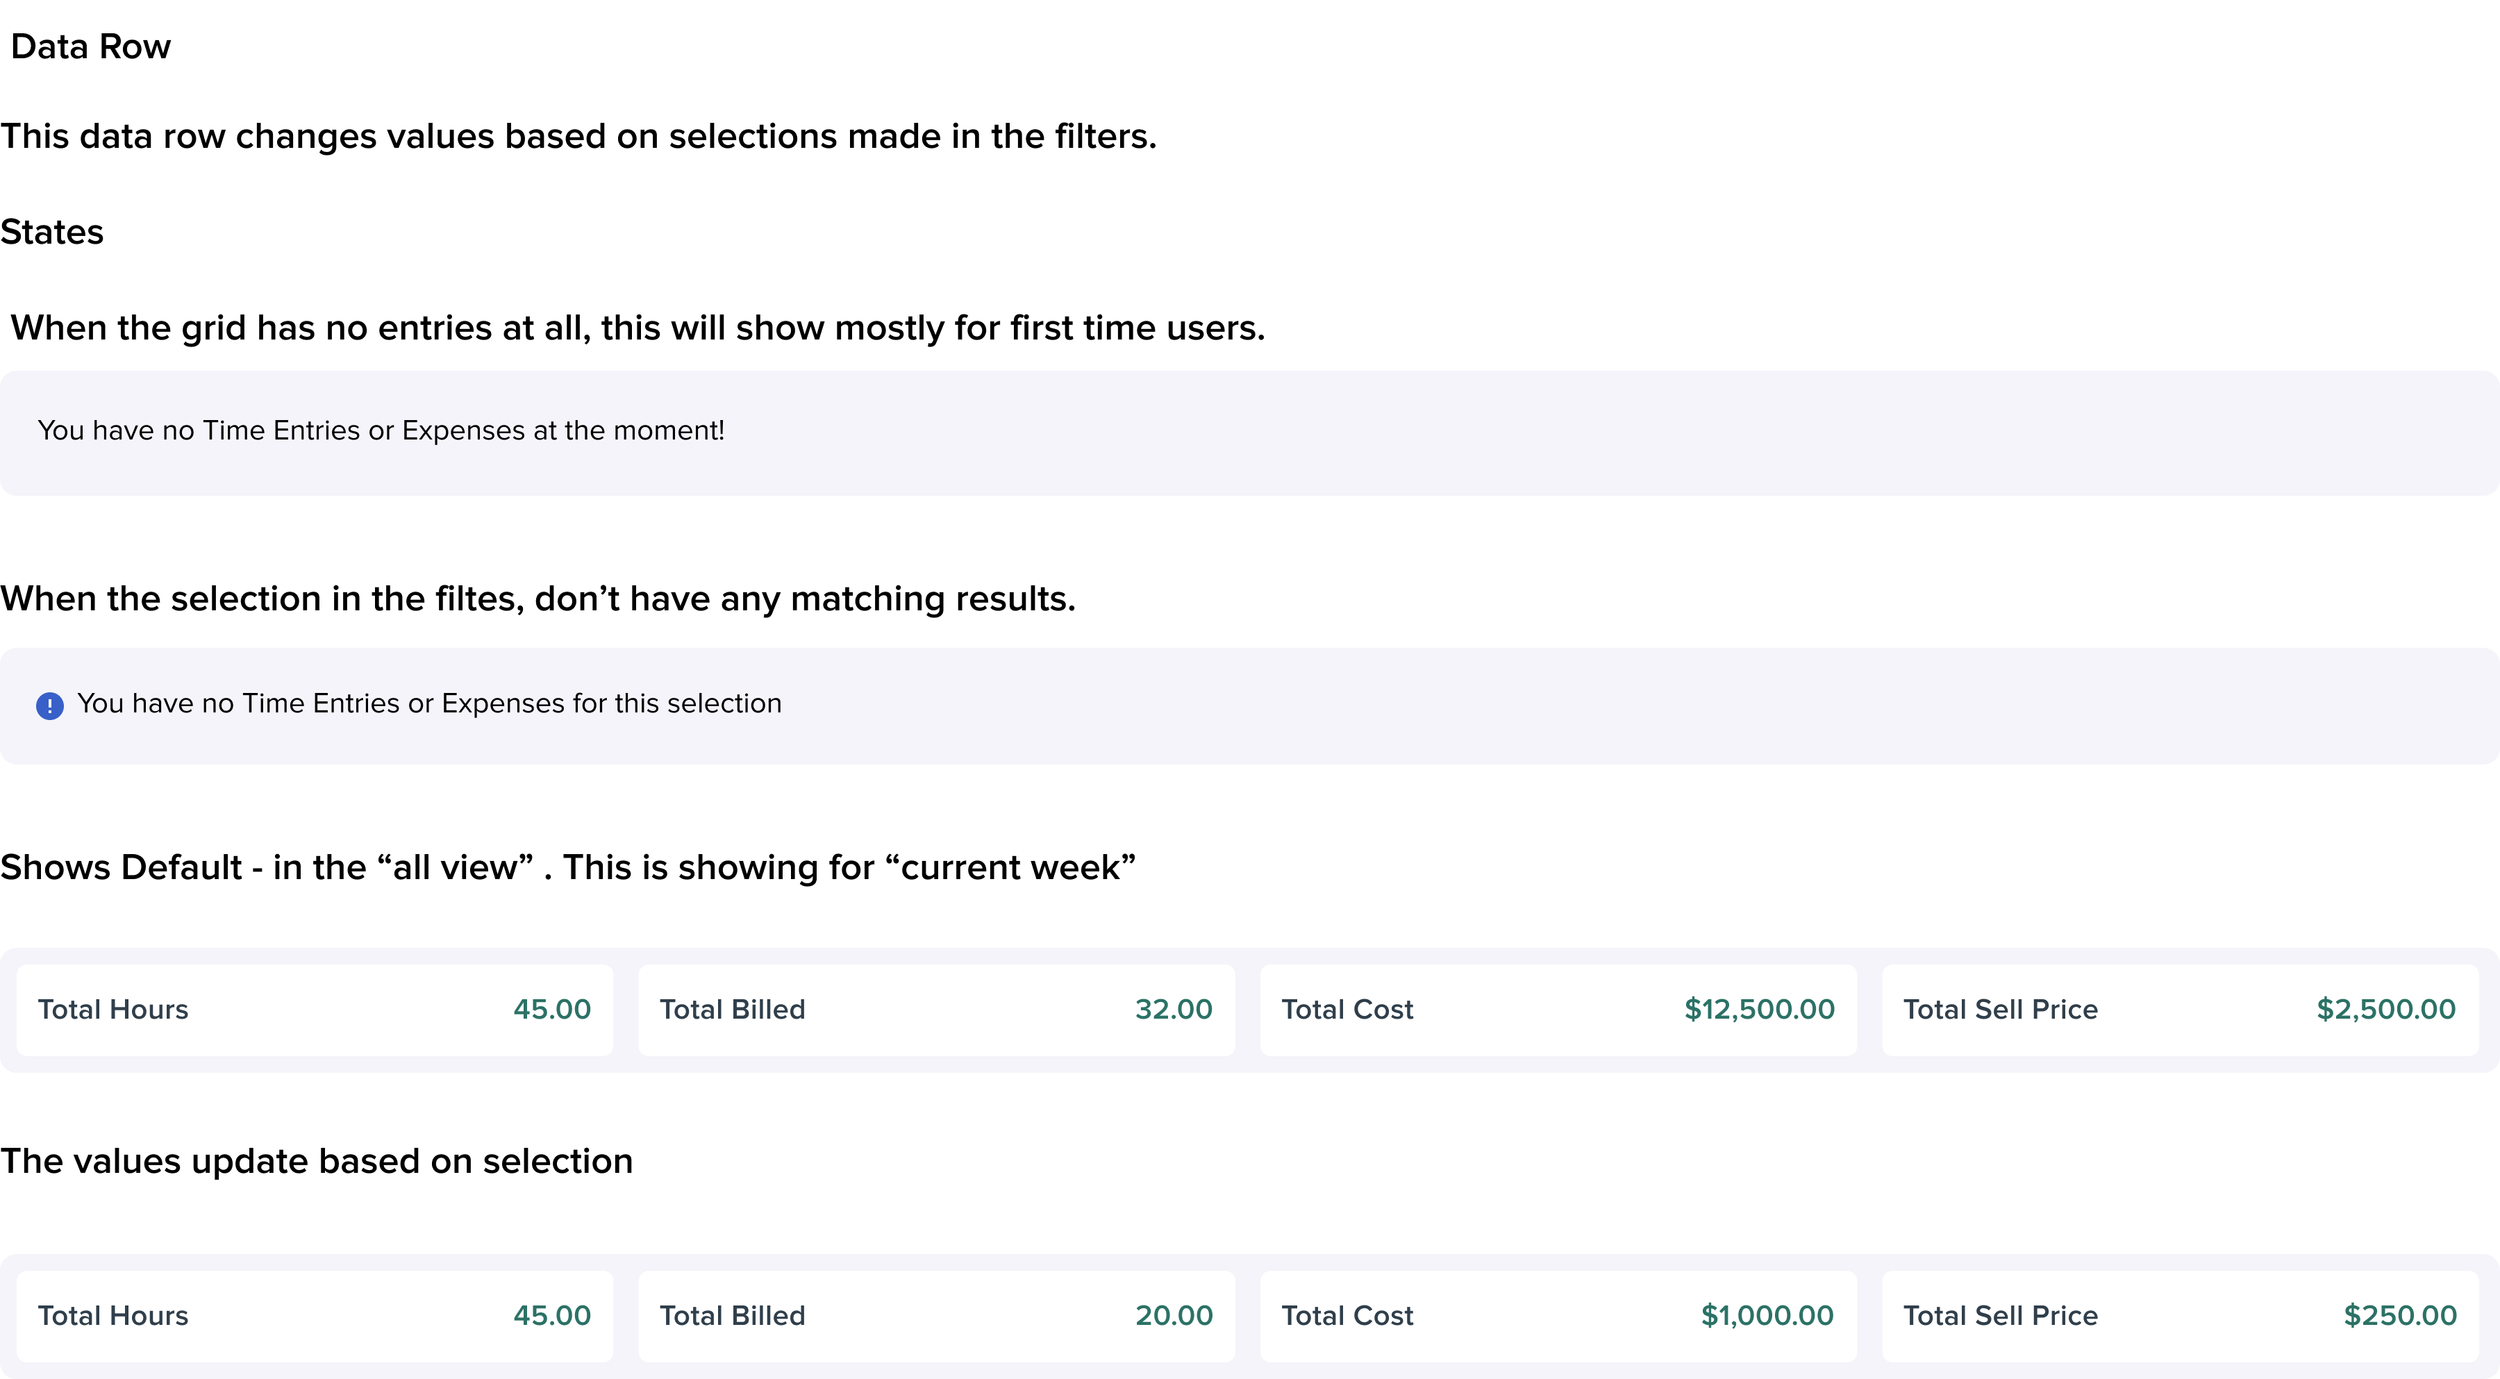
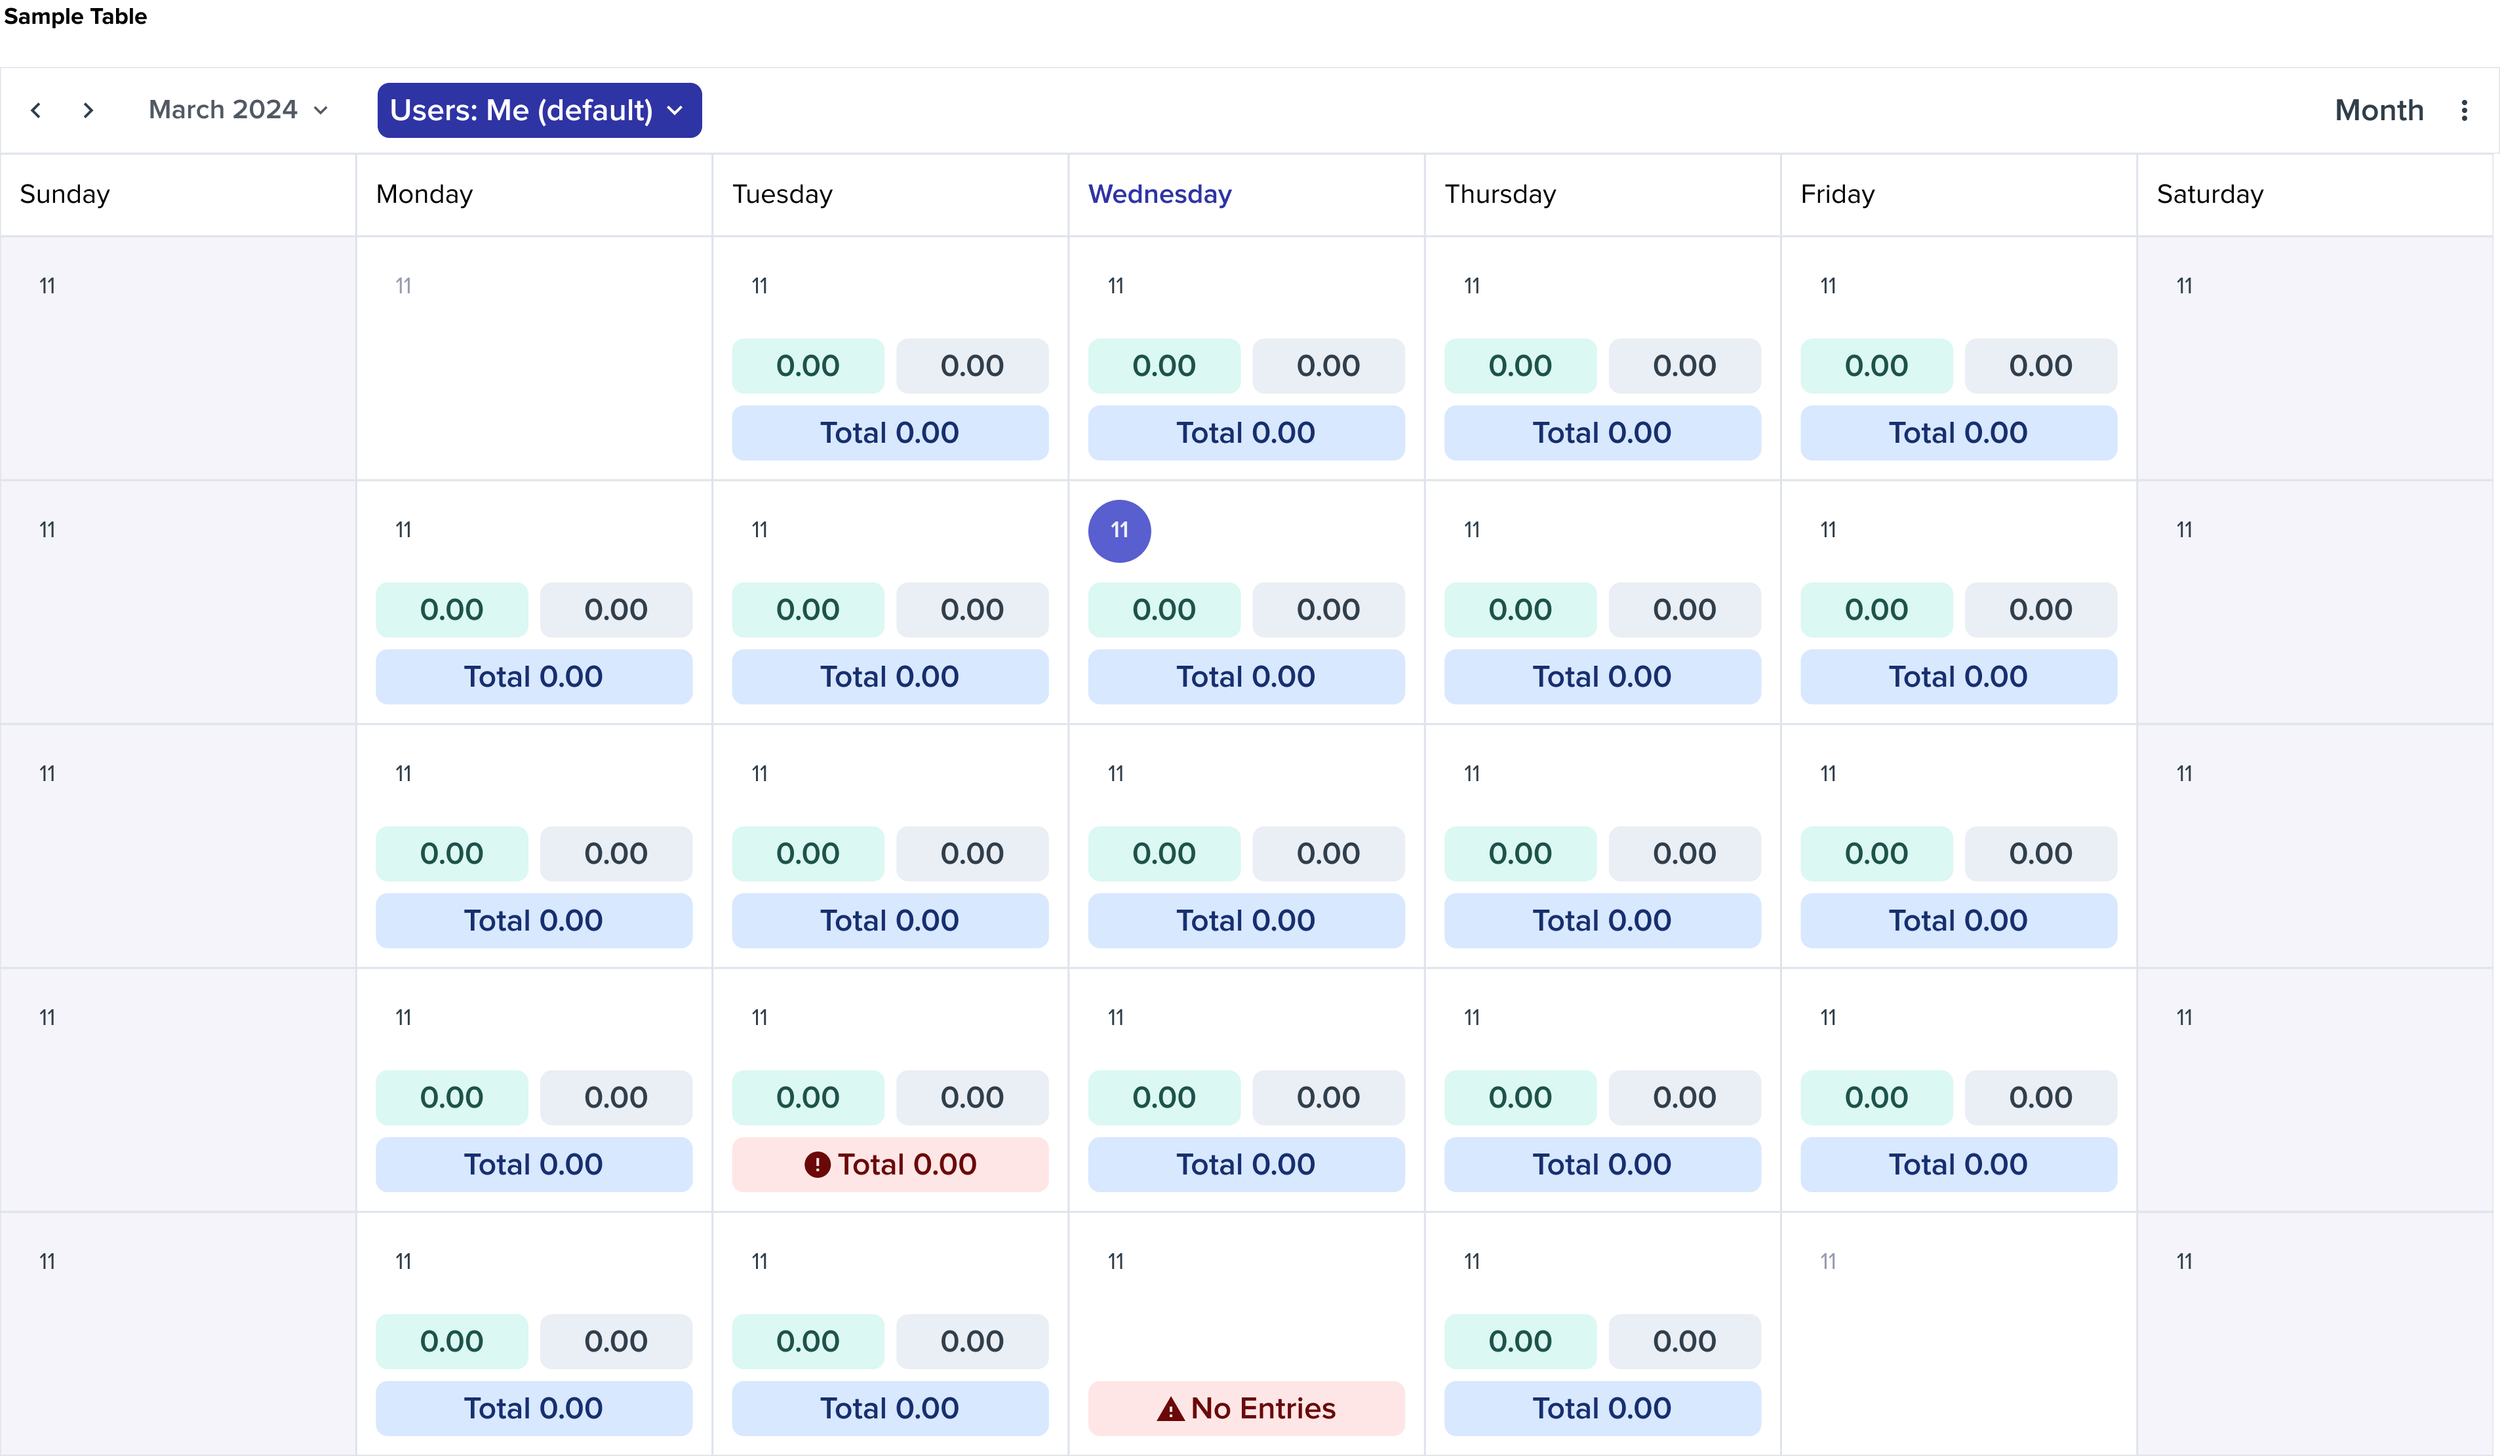
Design System Components
To ensure consistency and scalability, I created reusable components that solved usability gaps and laid a foundation for future growth.


Many iterations and reviews later with engineering and
leadership we launched our MVP
Final Design: Effortless Time & Expense Tracking
Attorneys can switch seamlessly between time, expenses, and calendar views; making it effortless to track and match billing data.
Quick filters let attorneys find exactly what they need fast, saving time on searches and reducing billing errors.
Bulk edits cut down repetitive admin work, letting attorneys spend less time on data entry and more time on clients.
The calendar view gives attorneys a clear snapshot of their billable vs. non-billable hours, helping them stay on track with targets.
Missed time entries are flagged instantly, ensuring attorneys never lose billable hours.
Firm admins and partners can see hours across the entire team, making performance tracking and oversight effortless.
Attorneys can drill directly into calendar cells to review detailed time entries; no extra clicks, no wasted time.
Launch & Impact
Mix Panel Events: Prior to launch we added multiple events to track the adoption of our new rolled out time expenses and calendar feature. Within the first weeks of launch, the redesigned Time Calendar and Time & Expense Grid saw rapid adoption and strong validation from users.
3hrs/week
saved on average by reducing manual checks according to surveys.
68%
of the active users started using the time calendar view in the first 2 weeks as reported by mix panel reports.
8.7/10
NPS rating by the early adopters with “ease of use” and “clarity” cited as top benefits.
Before

After
Key Learnings
Working on this project taught me that designing for attorneys and firms is about more than making things look good. It’s about helping them save time, reduce errors, and feel confident in their tools.

Design systems scale impact
Building reusable calendar + grid components meant this wasn’t just a one-off redesign; it set a foundation that future teams could build on quickly and consistently.

Testing uncovers the unexpected
Usability testing surfaced issues (dense grids, slow dropdowns) that can be easily be overlooked proving that even small tweaks can drive big usability wins.
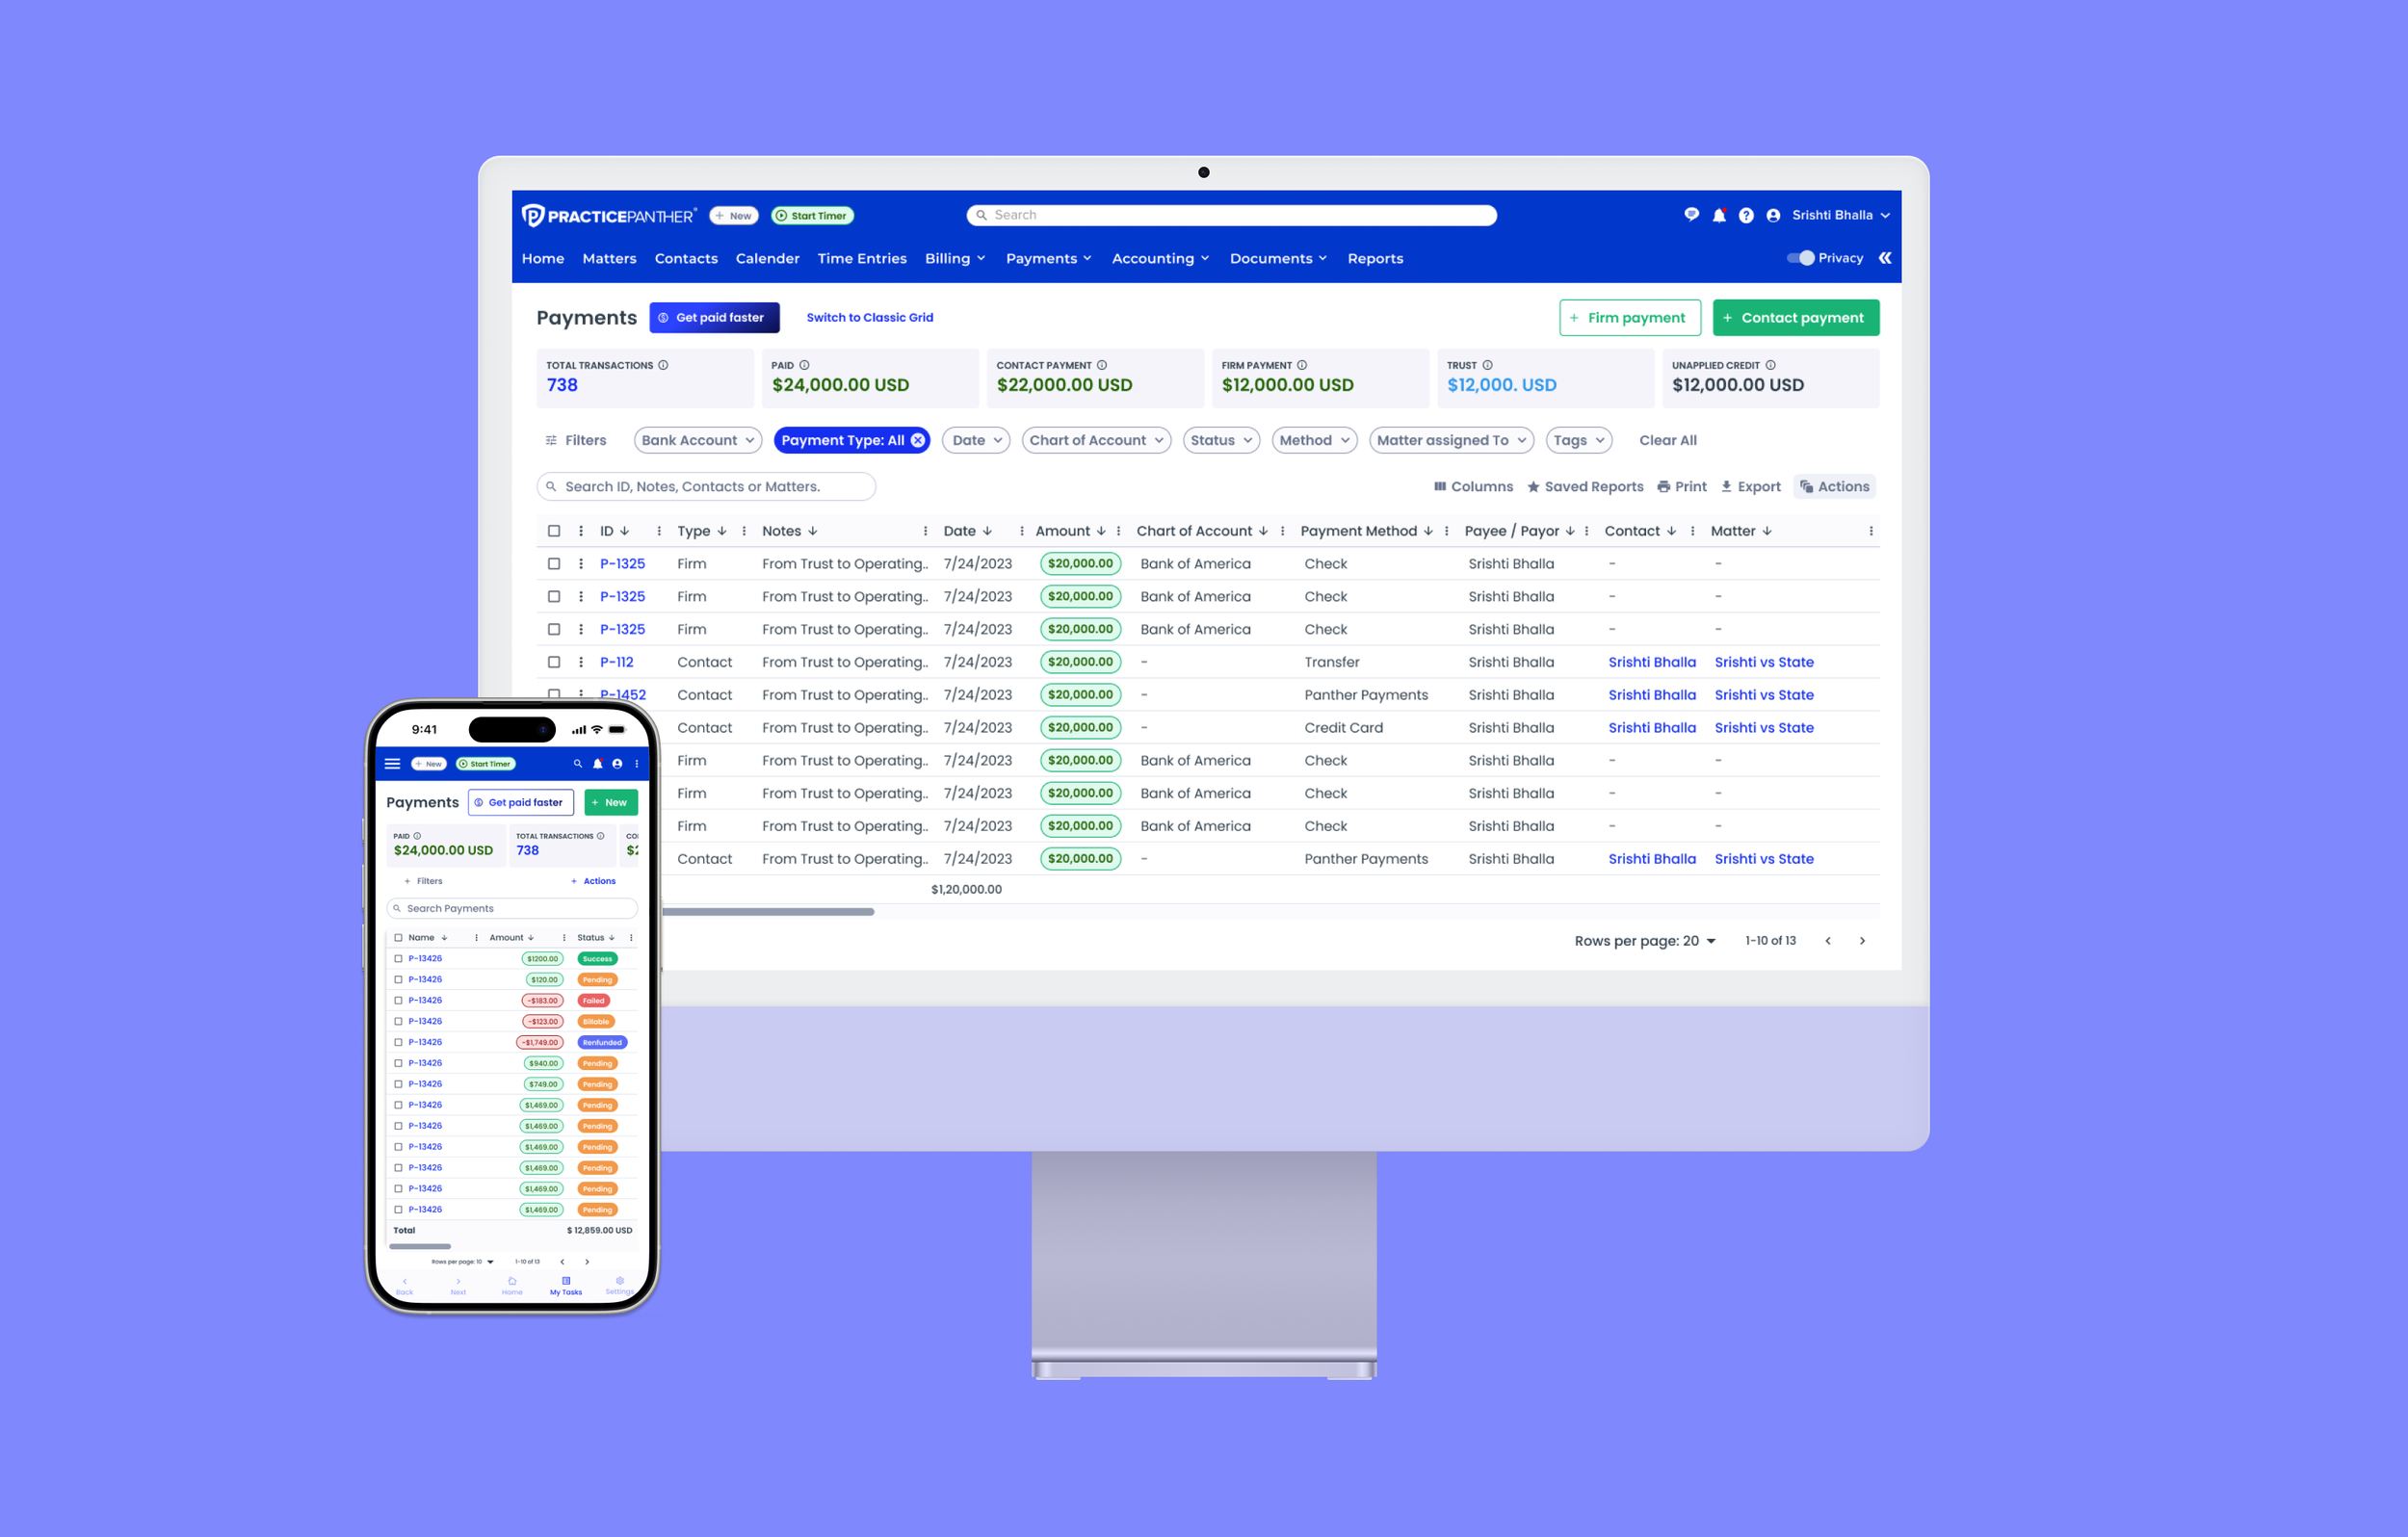
PRACTICEPANTHER
Streamlining Legal Workflows with PracticePanther’s Payments Grid
8.6/10 NPS was received by users in post launch
50 secs page refresh time from 7 mins previously
Full Redesign + Scalable System + Web & Mobile